
FIGURE
Figure 8
- ID
- ZDB-FIG-230416-15
- Publication
- Hou et al., 2023 - Integration of Metabolomics and Transcriptomics to Reveal the Metabolic Characteristics of Exercise-Improved Bone Mass
- Other Figures
- All Figure Page
- Back to All Figure Page
Figure 8
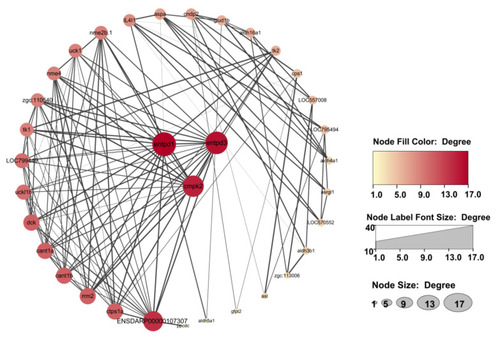
Protein–protein interaction network analysis of 35 differentially expressed genes in the four identified pathways. Entpd3, entpd1, and cmpk2 located in the center of the network are core genes. |
Expression Data
Expression Detail
Antibody Labeling
Phenotype Data
Phenotype Detail
Acknowledgments
This image is the copyrighted work of the attributed author or publisher, and
ZFIN has permission only to display this image to its users.
Additional permissions should be obtained from the applicable author or publisher of the image.
Full text @ Nutrients