
Image
|
Figure Caption
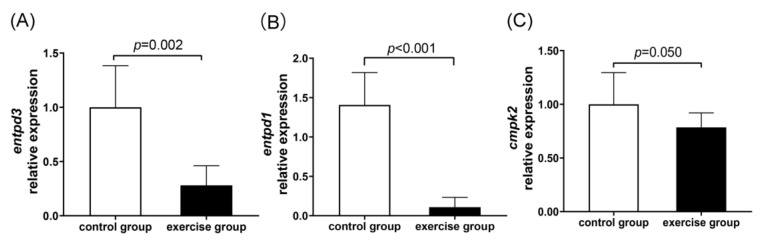
Figure 9
The results of mRNA expression by qRT-PCR for entpd3 (A), entpd1 (B), and cmpk2 (C, the core genes) in the control and exercise groups. All values are presented as mean and standard deviation. Student’s t test was used to compare the differences between the two groups.
Acknowledgments
This image is the copyrighted work of the attributed author or publisher, and
ZFIN has permission only to display this image to its users.
Additional permissions should be obtained from the applicable author or publisher of the image.
Full text @ Nutrients