
FIGURE
Figure 2
- ID
- ZDB-FIG-230416-9
- Publication
- Hou et al., 2023 - Integration of Metabolomics and Transcriptomics to Reveal the Metabolic Characteristics of Exercise-Improved Bone Mass
- Other Figures
- All Figure Page
- Back to All Figure Page
Figure 2
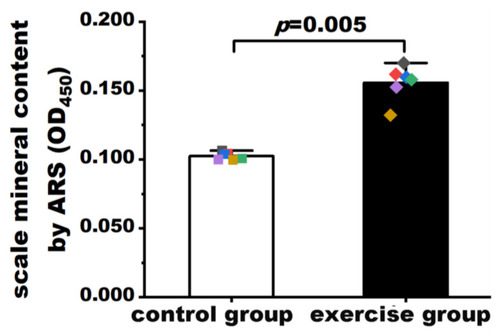
Quantification of mineralization in scales of the exercise and control groups. Values are expressed as mean and standard deviation. Student’s t test was used to compare the differences in mineralization levels between the exercise group and the control group. The black, red, blue, green, purple, and yellow squares represent control group fish numbers 13, 14, 15, 16, 17, and 18, respectively. The black, red, blue, green, purple, and yellow diamonds represent exercise group fish numbers 14, 15, 16, 17, 18, and 19, respectively. |
Expression Data
Expression Detail
Antibody Labeling
Phenotype Data
Phenotype Detail
Acknowledgments
This image is the copyrighted work of the attributed author or publisher, and
ZFIN has permission only to display this image to its users.
Additional permissions should be obtained from the applicable author or publisher of the image.
Full text @ Nutrients