
Image
|
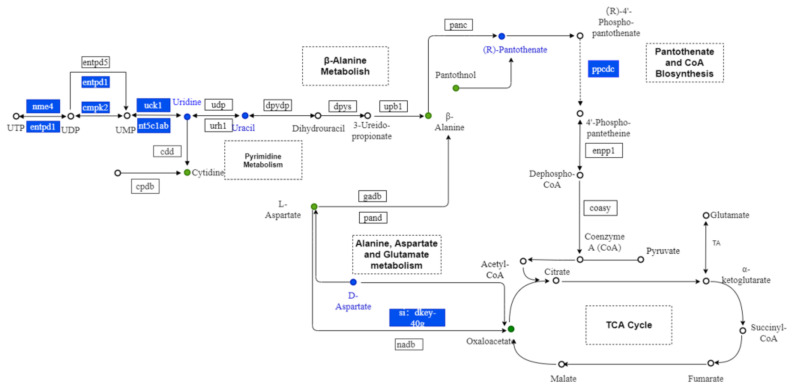
Figure Caption
Figure 10
Metabolic maps of alanine, aspartate, and glutamate metabolism, pantothenate and CoA biosynthesis; pyrimidine metabolism; and β-alanine metabolism. Dots represent the metabolites. Boxes represent the genes. Blue indicates downregulation.
Acknowledgments
This image is the copyrighted work of the attributed author or publisher, and
ZFIN has permission only to display this image to its users.
Additional permissions should be obtained from the applicable author or publisher of the image.
Full text @ Nutrients