
- Title
-
Methylenetetrahydrofolate reductase deficiency and high dose FA supplementation disrupt embryonic development of energy balance and metabolic homeostasis in zebrafish
- Authors
- Simonian, R., Pannia, E., Hammoud, R., Noche, R.R., Cui, X., Kranenburg, E., Kubant, R., Ashcraft, P., Wasek, B., Bottiglieri, T., Dowling, J.J., Anderson, G.H.
- Source
- Full text @ Hum. Mol. Genet.
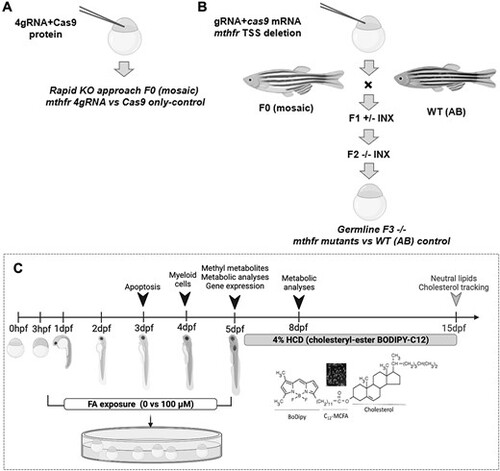
mthfr zebrafish model creation and study design. Schematic of the steps to generate (A) 4gRNA mthfr crispant zebrafish and (B) germline mthfr −/− mutant zebrafish (HSC194). (C) Simplified study design. Metabolic analyses included measures of food intake, metabolic rate and lipid accumulation. Analysis indicated by the gray arrowhead was performed following a 10-day HCD challenge. Abbreviations: F0, mutagenized generation; F1 +/−, first-generation zebrafish heterozygous for mthfr; F2 −/−, second-generation zebrafish nullizygous for mthfr; hpf, hours postfertilization; MCFA, medium chain fatty acid; WT, wild-type zebrafish from AB background. |
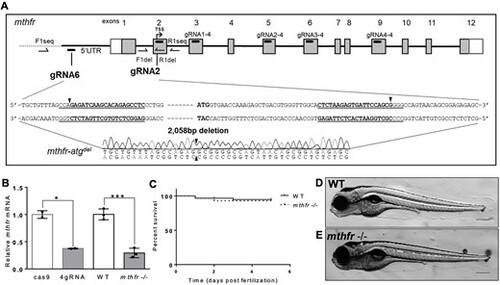
Generation of mthfr-deficient zebrafish by CRISPR mutagenesis. (A) Schematic representation of the zebrafish genome with guide RNA sequences identified in the mthfr gene. The 4gRNA target sequences (gRNA1/2/3/4-4) reside in exons 3, 5, 6 and 9. The two-gRNA approach (gRNA2 and gRNA6) targets sequences in the 5′ UTR and in exon 2, respectively, and results in a 2058 bp deletion (mthfr-atgdel) that includes the TSS. Black arrowheads show where gRNA cutting occurred. Boxes indicate exons, with white boxes representing UTR and gray boxes representing protein coding regions. Primer locations used for sequencing are shown. (B) Relative mthfr mRNA expression in 4gRNA mthfr crispants (4gRNA) and mthfr −/− mutant zebrafish (mthfr −/−, HSC194) compared with their respective controls at 5 dpf. Values are mean ± SEM, n = 2–3 biological replicates of n = 20 pooled zebrafish/group. Each pool was composed of n = 20 larvae. Analyzed by Student’s t-test. Significant at *P < 0.05 and ***P < 0.001. (C) Kaplan–Meier curve showing percent survival of WT and mthfr −/− mutant zebrafish larvae throughout embryonic development from 0 to 5 dpf. n = 60 larvae/group/petri dish at the start of analysis. (D, E) Representative image of (D) WT and (E) mthfr −/− mutant zebrafish at 5 dpf showing no obvious morphological differences. 10× magnification, scale bar = 200 μm. |
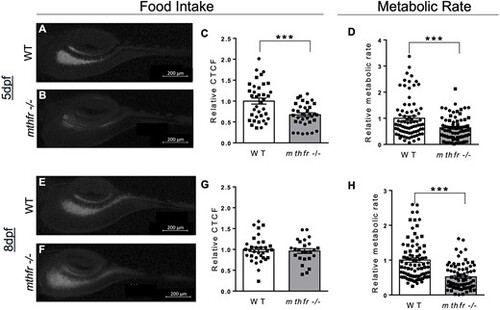
Food intake and metabolic rate are affected by mthfr deficiency in larvae. (A, B) Representative images of zebrafish intestinal content following feeding with fluorescent paramecia in (A) WT controls and (B) mthfr −/− mutant zebrafish (mthfr −/−, HSC194) at 5 dpf. (C) Food intake, measured by relative CTCF, at 5 dpf in WT compared with mthfr −/− mutants. (D) Relative metabolic rate in WT versus mthfr −/− at 5 dpf. (E, F) Representative images following feeding with fluorescent paramecia in (D) WT and (E) mthfr −/− at 8 dpf. (F) Relative CTCF at 8 dpf in WT compared with mthfr −/− mutants. (G) Relative CTCF at 8 dpf in WT compared with mthfr −/− mutants. (H) Relative metabolic rate in WT versus mthfr −/− at 8 dpf. For all food intake measures: 80× magnification, scale bar = 200 μm, n = 20/group. All values are mean ± SEM. Analyzed by Student’s t-test. Significant at *P < 0.05, **P < 0.01, ***P < 0.0001. |
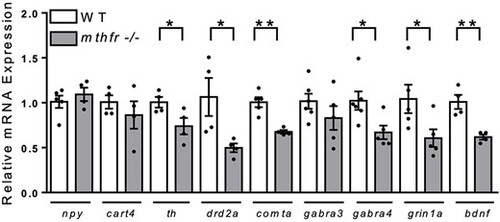
Central regulatory gene expression was altered in mthfr −/− at 5 dpf. All values are relative to control. Mean ± SEM, n = 5 larval heads/pool, 4–5 pools/group. Analyzed by Student’s t-test. Significance at *P < 0.05, **P < 0.01. Abbreviations: mthfr −/−, 5-methylenetrahydrofolate reductase homozygous KO germline zebrafish mutants (HSC194); WT, wild-type control zebrafish. |
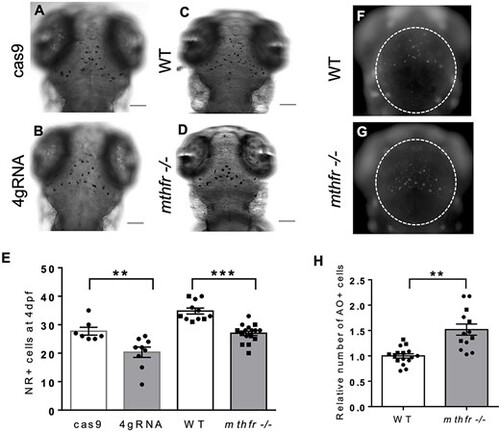
mthfr deficiency in zebrafish reduces microglia and increases apoptosis in the optic tectum. (A–D) Representative bright-field images of NR+ staining at 4 dpf for microglia in (A) cas9, (B) 4gRNA, (C) WT and (D) mthfr −/− mutant zebrafish (mthfr −/−, HSC194). 80× magnification, scale bar = 100 μm. (E) Number of NR+ cells at 4 dpf. n = 8–14 larvae/group. Analyzed by one-way ANCOVA with ‘batch’ as a covariate. Significance at **P < 0.01 and ***P < 0.001. (F, G) Representative fluorescent images of 3 dpf (F) WT and (G) mthfr −/− zebrafish stained with AO. (H) Number of AO+ cells at 3 dpf. White dotted line outlines area of quantification. 80× magnification, scale bar = 200 μm. Analyzed by Student’s t-test. Significant at ***P < 0.001. All values are mean ± SEM. Circles represent one individual zebrafish from batch 1 and squares represent zebrafish from batch 2. |
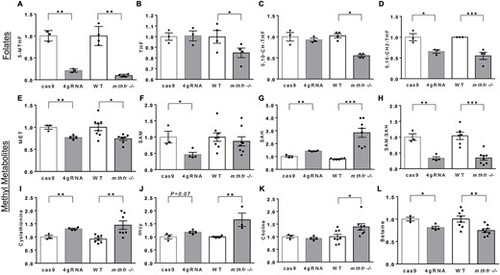
mthfr deficiency in zebrafish reduces folates and alters 1-carbon cycle methyl metabolites. Relative concentrations of whole-body (A–D) folates and (E–L) related 1-carbon metabolites in zebrafish larvae at 5 dpf. Comparisons were conducted between cas9 versus 4gRNA mthfr crispants (4gRNA) or age-matched WT controls versus mthfr −/− mutants (mthfr −/−, HSC194). Values are mean ± SEM, n = 3–4 biological replicates of pooled zebrafish/group. Each pool was composed of n = 40 larvae for folates and n = 20 larvae for methyl metabolites for cas9 versus 4gRNA mthfr crispants and n = 50 larvae for folates and n = 30 larvae for methyl metabolites for WT versus mthfr −/− mutants. No differences in pooled weight were observed. Analyzed by Student’s t-test stratified by mutagenesis approach. Significant at *P < 0.05, **P < 0.01, ***P < 0.0001. Abbreviations: tHcy, total homocysteine; 5,10-CH-THF, 5,10-methenyltetrahydrofolate; 5,10-CH2-THF, 5,10-methylenetetrahydrofolate. |
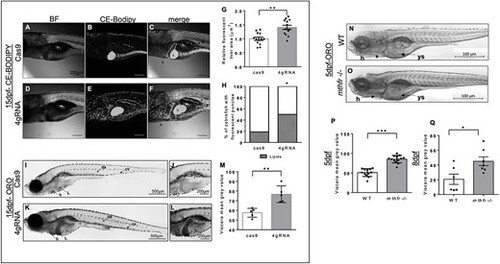
Lipid accumulation is greater in mthfr zebrafish compared with controls. (A–F) Representative bright field (BF) and fluorescent confocal images of (A–C) cas9 control (cas9) and (D–F) 4gRNA mthfr crispants (4gRNA) fed a 4% HCD with ce-BoDipy-C12® from 5 to 15 dpf. Fluorescent liver area is outlined by a white dotted line and green fluorescence represents CEs. 10× magnification, scale bar = 200 μm. (G) Relative fluorescent liver area and (H) percentage of larvae with excess circulating lipids were compared between cas9 and 4gRNA zebrafish. n = 13–18 larvae/group. Analyzed by one-way ANCOVA with ‘batch’ as a covariate. Significance at *P < 0.05. (I–L) Representative bright-field images of (I, J) cas9 and (K, L) 4gRNA zebrafish stained with ORO at 15 dpf following 10 days of HCD feeding. White dotted line outlines liver area. 20× magnification, scale bar = 500 μm for images I and K and 40× magnification, scale bar = 200 μm for panels J and L. (M) Calculated mean gray area of viscera region at 15 dpf. n = 4–5 larvae/group. Analyzed by Student’s t-test. Significance at *P < 0.05, **P < 0.01. (N, O) Representative BF images of WT controls and 5-methylenetrahydrofolate reductase homozygous KO germline zebrafish mutants (mthfr −/−, HSC194) at 5 dpf stained with ORO. 20× magnification, scale bar = 500 μm. Calculated mean gray area of viscera region at (P) 5 dpf and (Q) 8 dpf. n = 12–13 larvae/group. Analyzed by one-way ANCOVA with ‘batch’ as a covariate. Significance at *P < 0.05 and ***P < 0.0001. Letters and arrows show areas of interest: h, heart; da, dorsal artery; isv, intersegmental area; pcv, posterior cardinal vein; ys, yolk syncytial layer; L, liver; g, gallbladder; i, intestine. All values are mean ± SEM. Circles represent one individual zebrafish from batch 1 and squares represent zebrafish from batch 2. |

FA dose and mthfr genotype interact to affect metabolic outcomes. (A) Calculated mean gray area of viscera region at 5 dpf in WT and mthfr −/− mutants (mthfr −/−, HSC194) exposed to either 0 or 100 mm FA from 0 to 5 dpf and stained with ORO. (B) Relative metabolic rate at 5 dpf of WT and mthfr −/− exposed to either 0 or 100 mm FA from 0 to 5 dpf. (C) Number of NR+ cells at 4 dpf WT and mthfr −/− exposed to either 0 or 100 mm FA from 0 to 4 dpf. (D) Relative food intake, measured by CTCF, at 5 dpf in WT and mthfr −/− exposed to either 0 or 100 mm FA from 0 to 5 dpf. All values are mean ± SEM. Analyzed by two-way ANOVA with FA dose (0 versus 100 mm) and mthfr genotype (WT versus mthfr −/−) as main factors and a Dose × Genotype interaction term. Significant at P < 0.05. Values in bold indicate significant effects. Circles represent one individual zebrafish from batch 1 and squares represent zebrafish from batch 2. |