
|
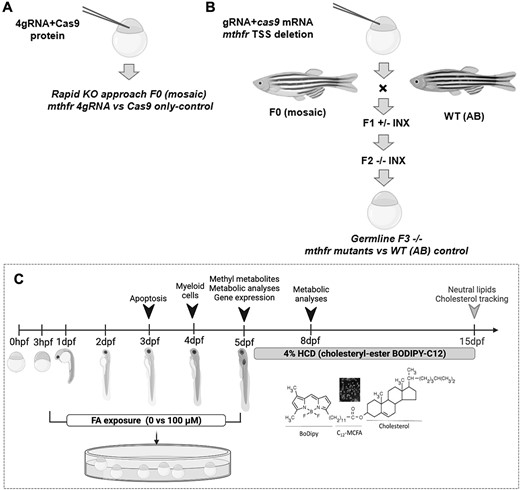
Fig. 1 mthfr zebrafish model creation and study design. Schematic of the steps to generate (A) 4gRNA mthfr crispant zebrafish and (B) germline mthfr −/− mutant zebrafish (HSC194). (C) Simplified study design. Metabolic analyses included measures of food intake, metabolic rate and lipid accumulation. Analysis indicated by the gray arrowhead was performed following a 10-day HCD challenge. Abbreviations: F0, mutagenized generation; F1 +/−, first-generation zebrafish heterozygous for mthfr; F2 −/−, second-generation zebrafish nullizygous for mthfr; hpf, hours postfertilization; MCFA, medium chain fatty acid; WT, wild-type zebrafish from AB background.