
|
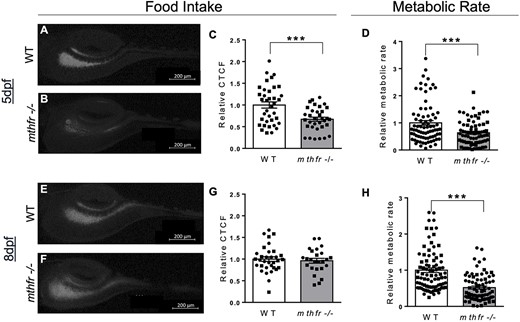
Fig. 3 Food intake and metabolic rate are affected by mthfr deficiency in larvae. (A, B) Representative images of zebrafish intestinal content following feeding with fluorescent paramecia in (A) WT controls and (B) mthfr −/− mutant zebrafish (mthfr −/−, HSC194) at 5 dpf. (C) Food intake, measured by relative CTCF, at 5 dpf in WT compared with mthfr −/− mutants. (D) Relative metabolic rate in WT versus mthfr −/− at 5 dpf. (E, F) Representative images following feeding with fluorescent paramecia in (D) WT and (E) mthfr −/− at 8 dpf. (F) Relative CTCF at 8 dpf in WT compared with mthfr −/− mutants. (G) Relative CTCF at 8 dpf in WT compared with mthfr −/− mutants. (H) Relative metabolic rate in WT versus mthfr −/− at 8 dpf. For all food intake measures: 80× magnification, scale bar = 200 μm, n = 20/group. All values are mean ± SEM. Analyzed by Student’s t-test. Significant at *P < 0.05, **P < 0.01, ***P < 0.0001.