
Fig. 7
- ID
- ZDB-FIG-230913-17
- Publication
- Simonian et al., 2023 - Methylenetetrahydrofolate reductase deficiency and high dose FA supplementation disrupt embryonic development of energy balance and metabolic homeostasis in zebrafish
- Other Figures
- All Figure Page
- Back to All Figure Page
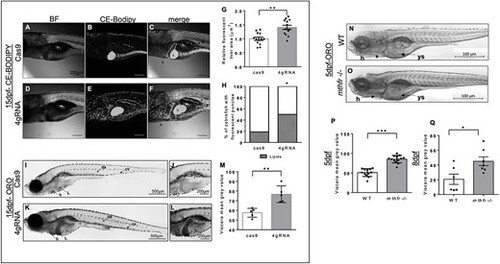
Lipid accumulation is greater in mthfr zebrafish compared with controls. (A–F) Representative bright field (BF) and fluorescent confocal images of (A–C) cas9 control (cas9) and (D–F) 4gRNA mthfr crispants (4gRNA) fed a 4% HCD with ce-BoDipy-C12® from 5 to 15 dpf. Fluorescent liver area is outlined by a white dotted line and green fluorescence represents CEs. 10× magnification, scale bar = 200 μm. (G) Relative fluorescent liver area and (H) percentage of larvae with excess circulating lipids were compared between cas9 and 4gRNA zebrafish. n = 13–18 larvae/group. Analyzed by one-way ANCOVA with ‘batch’ as a covariate. Significance at *P < 0.05. (I–L) Representative bright-field images of (I, J) cas9 and (K, L) 4gRNA zebrafish stained with ORO at 15 dpf following 10 days of HCD feeding. White dotted line outlines liver area. 20× magnification, scale bar = 500 μm for images I and K and 40× magnification, scale bar = 200 μm for panels J and L. (M) Calculated mean gray area of viscera region at 15 dpf. n = 4–5 larvae/group. Analyzed by Student’s t-test. Significance at *P < 0.05, **P < 0.01. (N, O) Representative BF images of WT controls and 5-methylenetrahydrofolate reductase homozygous KO germline zebrafish mutants (mthfr −/−, HSC194) at 5 dpf stained with ORO. 20× magnification, scale bar = 500 μm. Calculated mean gray area of viscera region at (P) 5 dpf and (Q) 8 dpf. n = 12–13 larvae/group. Analyzed by one-way ANCOVA with ‘batch’ as a covariate. Significance at *P < 0.05 and ***P < 0.0001. Letters and arrows show areas of interest: h, heart; da, dorsal artery; isv, intersegmental area; pcv, posterior cardinal vein; ys, yolk syncytial layer; L, liver; g, gallbladder; i, intestine. All values are mean ± SEM. Circles represent one individual zebrafish from batch 1 and squares represent zebrafish from batch 2. |