
|
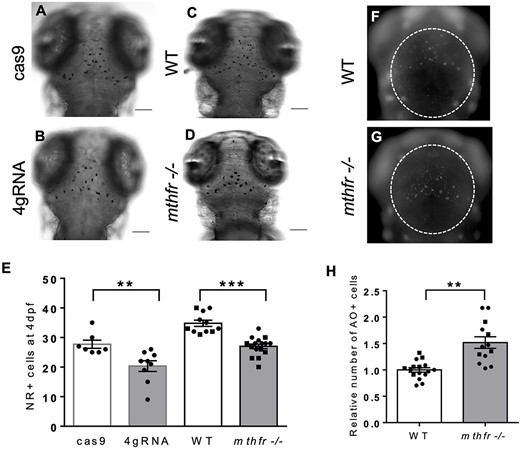
Fig. 5 mthfr deficiency in zebrafish reduces microglia and increases apoptosis in the optic tectum. (A–D) Representative bright-field images of NR+ staining at 4 dpf for microglia in (A) cas9, (B) 4gRNA, (C) WT and (D) mthfr −/− mutant zebrafish (mthfr −/−, HSC194). 80× magnification, scale bar = 100 μm. (E) Number of NR+ cells at 4 dpf. n = 8–14 larvae/group. Analyzed by one-way ANCOVA with ‘batch’ as a covariate. Significance at **P < 0.01 and ***P < 0.001. (F, G) Representative fluorescent images of 3 dpf (F) WT and (G) mthfr −/− zebrafish stained with AO. (H) Number of AO+ cells at 3 dpf. White dotted line outlines area of quantification. 80× magnification, scale bar = 200 μm. Analyzed by Student’s t-test. Significant at ***P < 0.001. All values are mean ± SEM. Circles represent one individual zebrafish from batch 1 and squares represent zebrafish from batch 2.