
Fig. 2
- ID
- ZDB-FIG-230913-12
- Publication
- Simonian et al., 2023 - Methylenetetrahydrofolate reductase deficiency and high dose FA supplementation disrupt embryonic development of energy balance and metabolic homeostasis in zebrafish
- Other Figures
- All Figure Page
- Back to All Figure Page
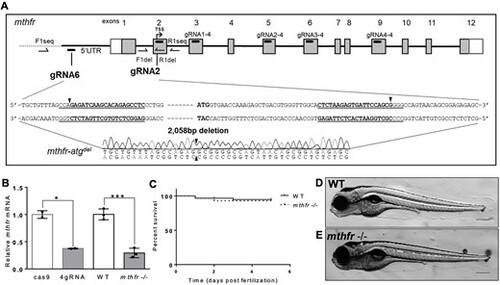
Generation of mthfr-deficient zebrafish by CRISPR mutagenesis. (A) Schematic representation of the zebrafish genome with guide RNA sequences identified in the mthfr gene. The 4gRNA target sequences (gRNA1/2/3/4-4) reside in exons 3, 5, 6 and 9. The two-gRNA approach (gRNA2 and gRNA6) targets sequences in the 5′ UTR and in exon 2, respectively, and results in a 2058 bp deletion (mthfr-atgdel) that includes the TSS. Black arrowheads show where gRNA cutting occurred. Boxes indicate exons, with white boxes representing UTR and gray boxes representing protein coding regions. Primer locations used for sequencing are shown. (B) Relative mthfr mRNA expression in 4gRNA mthfr crispants (4gRNA) and mthfr −/− mutant zebrafish (mthfr −/−, HSC194) compared with their respective controls at 5 dpf. Values are mean ± SEM, n = 2–3 biological replicates of n = 20 pooled zebrafish/group. Each pool was composed of n = 20 larvae. Analyzed by Student’s t-test. Significant at *P < 0.05 and ***P < 0.001. (C) Kaplan–Meier curve showing percent survival of WT and mthfr −/− mutant zebrafish larvae throughout embryonic development from 0 to 5 dpf. n = 60 larvae/group/petri dish at the start of analysis. (D, E) Representative image of (D) WT and (E) mthfr −/− mutant zebrafish at 5 dpf showing no obvious morphological differences. 10× magnification, scale bar = 200 μm. |