
|
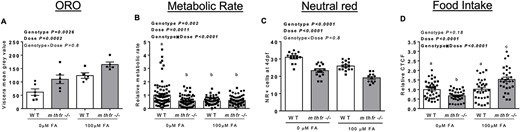
Fig. 8 FA dose and mthfr genotype interact to affect metabolic outcomes. (A) Calculated mean gray area of viscera region at 5 dpf in WT and mthfr −/− mutants (mthfr −/−, HSC194) exposed to either 0 or 100 mm FA from 0 to 5 dpf and stained with ORO. (B) Relative metabolic rate at 5 dpf of WT and mthfr −/− exposed to either 0 or 100 mm FA from 0 to 5 dpf. (C) Number of NR+ cells at 4 dpf WT and mthfr −/− exposed to either 0 or 100 mm FA from 0 to 4 dpf. (D) Relative food intake, measured by CTCF, at 5 dpf in WT and mthfr −/− exposed to either 0 or 100 mm FA from 0 to 5 dpf. All values are mean ± SEM. Analyzed by two-way ANOVA with FA dose (0 versus 100 mm) and mthfr genotype (WT versus mthfr −/−) as main factors and a Dose × Genotype interaction term. Significant at P < 0.05. Values in bold indicate significant effects. Circles represent one individual zebrafish from batch 1 and squares represent zebrafish from batch 2.