FIGURE SUMMARY
Title

Sexual dimorphic effects of igf1 deficiency on metabolism in zebrafish

Authors
Zeng, N., Bao, J., Shu, T., Shi, C., Zhai, G., Jin, X., He, J., Lou, Q., Yin, Z.
Source
Full text @ Front Endocrinol (Lausanne)

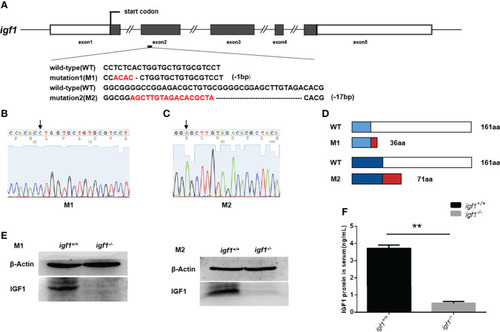
Generation of igf1-deficient zebrafish. (A) The diagram shows the endogenous structure of the zebrafish igf1 gene locus and selected targeting region. The dark boxes represent the coding regions the hollow boxes indicate non-translated regions, and the lines represent introns. The target site of CRISPR/Cas9 was located at exon 2. Two mutant lines were obtained at different target sites, namely mutant 1 (M1, -1bp) and mutant 2 (M2, -17bp). (B, C) Sequencing image of igf1 in M1 (B) and M2 (C). The arrowhead indicates the upstream border of the deletions. (D) Diagram showing the putative peptides of the wild-type IGF1, M1, and M2 peptides. The mutant lines with putative peptides identical to those of WT fish are shown as blue areas, and the red areas indicate miscoded amino acids. (E) Western blotting of IGF1 protein in the hepatic organ of mutants and control siblings. Three biological repeats were carried out. (F) Circulating IGF1 levels of IGF1 were determined through ELISA. Four animals were sampled for each experiment and three biological repeats were carried out and statistical analysis was performed using a t test (P<0.01, n=3). **P < 0.01.

EXPRESSION / LABELING:
Gene:
Antibody:
Fish:
Anatomical Terms:
Stage: Adult
PHENOTYPE:
Fish:
Observed In:
Stage: Adult

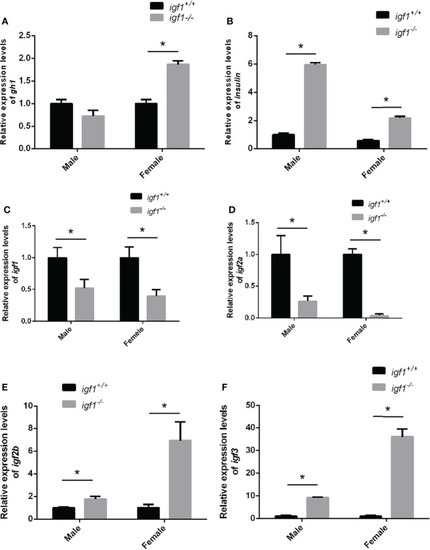
Feeding-back transcriptional levels of igf1 gene (A, B) Relative expression levels of gh1(A) and insulin(B) in igf1-deficient fish and the control wild-type fish and three biological repeats were carried out and statistical analysis was performed using a t test (n=3). (C–F) Relative expression levels of igf1, igf2a, igf2b and igf3 in igf1-deficient fish and the control wild-type fish and three biological repeats were carried out and statistical analysis was performed using a t test (n=3). There was no difference between the two internal reference gene (β-actin and EF1α). Four animals were sampled for each experiment and three biological repeats were carried out and statistical analysis was performed using a t test. The asterisk "*" represented significant difference, P<0.05.

Transcriptional levels of igf1 related genes (A, B) Relative expression levels of igf1ra and igf1rb in igf1-deficient fish and the control wild-type fish and three biological repeats were carried out and statistical analysis was performed using a t test (n=3). (C–F) Relative expression levels of igfbp1a, igfbp1b, igfbp3 and igfbp7 in igf1-deficient fish and the control wild-type fish and three biological repeats were carried out and statistical analysis was performed using a t test (n=3). There was no difference between the two internal reference gene (β-actin and EF1α). Four animals were sampled for each experiment and three biological repeats were carried out and statistical analysis was performed using a t test (p<0.001, n=3). **P < 0.01.

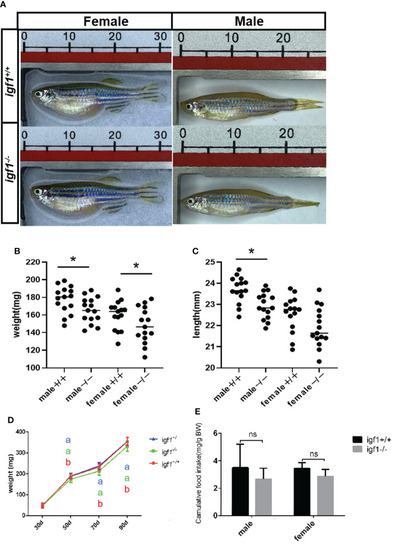
General growth performance traits of igf1-deficient fish. (A) Appearance of igf1-deficient fish and their control wild-type fish at 90 dpf (n=15/group). (B, C) Body weight of the fish at the 90-dpf stage. Three times of independent growth analysis were carried out and showed similar results. *P < 0.05. (D) Growth curves of wild type, heterozygous and igf1-deficient zebrafish during the growth statge. (E) The food intake data was showed in the chart. 10 animals were weighted for each experiment and three biological repeats were carried out and statistical analysis was performed using a t test (ns, p>0.05, n=3). The letters a and b in the charts represent significant differences between which labeled with different letters.

Hepatic steatosis observed in igf1-deficient male fish. (A) Body fat composition of igf1-deficient and wildtype control. (B, C) Frozen section and oil-red O staining of the hepatic tissue. Lower magnification images are shown at 10X, higher magnification of the indicated regions is shown at 20X. (D) Triglyceride content of the hepatic organ of igf1-deficient fish compared to controls (n = 6/group). *P < 0.05.

Alterations of glucose metabolism in igf1-deficient fish. (A) Postprandial plasma glucose levels (1 h after each meal) of igf1-deficient fish and sdminastration of recombinanat IGF1 protein(n = 6/group). The letters a, b and in the charts represent significant differences between which labeled with different letters. (B) Relative expression of pepck gene. (C) The hepatic lactate/pyruvate ratios of igf1-deficient fish (n = 8/group). (D) The hepatic 2DG6P levels of igf1-deficient fish. *P < 0.05; **P < 0.01.

EXPRESSION / LABELING:
Gene:
Fish:
Anatomical Terms:
Stage: Adult
PHENOTYPE:
Fish:
Observed In:
Stage: Adult

The phosphorylation levels of several key kinases in the hepatic tissue of igf1-deficient fish. (A, B) Western blot analysis of hepatic actin, p-S6, Akt, p-Akt, AMPK, p-AMPK, Erk1/2, and p-Erk1/2 in igf1-deficient male (A) and female (B) fish. (C, D) The data were analyzed by quantifying the protein results using the ImageJ software. Relative expression of p-S6, p-Akt, p-AMPK, and p-Erk1/2 in male (C) and female (D) zebra fish. *P < 0.05; ***P < 0.001.

E2 rescue the hepatic steatosis and the AKT-mTOR signaling activity in liver. (A, B) Relative expression of gh1 gene in pitutary (A) of igf1-deficient and wild type treated in E2(100μg/L). Triglyceride composition in liver (B) of igf1-deficient and wild type treated in E2(100μg/L). An independent experiment was carried out in which the control group zebrafish was treated with 5% DMSO in fish water. (C, D) Western blot analysis of hepatic AKT-mTOR signal activity in male zebrafish. Four animals were sampled for each experiment and three biological repeats were carried out and statistical analysis was performed using a t test (p<0.001, n=3). *p < 0.05, ***P < 0.001.

Acknowledgments
This image is the copyrighted work of the attributed author or publisher, and ZFIN has permission only to display this image to its users. Additional permissions should be obtained from the applicable author or publisher of the image. Full text @ Front Endocrinol (Lausanne)