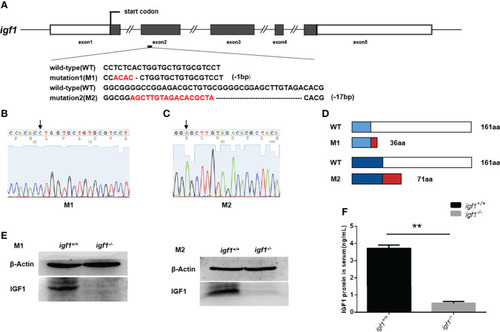
Generation of igf1-deficient zebrafish. (A) The diagram shows the endogenous structure of the zebrafish igf1 gene locus and selected targeting region. The dark boxes represent the coding regions the hollow boxes indicate non-translated regions, and the lines represent introns. The target site of CRISPR/Cas9 was located at exon 2. Two mutant lines were obtained at different target sites, namely mutant 1 (M1, -1bp) and mutant 2 (M2, -17bp). (B, C) Sequencing image of igf1 in M1 (B) and M2 (C). The arrowhead indicates the upstream border of the deletions. (D) Diagram showing the putative peptides of the wild-type IGF1, M1, and M2 peptides. The mutant lines with putative peptides identical to those of WT fish are shown as blue areas, and the red areas indicate miscoded amino acids. (E) Western blotting of IGF1 protein in the hepatic organ of mutants and control siblings. Three biological repeats were carried out. (F) Circulating IGF1 levels of IGF1 were determined through ELISA. Four animals were sampled for each experiment and three biological repeats were carried out and statistical analysis was performed using a t test (P<0.01, n=3). **P < 0.01.
|
