|
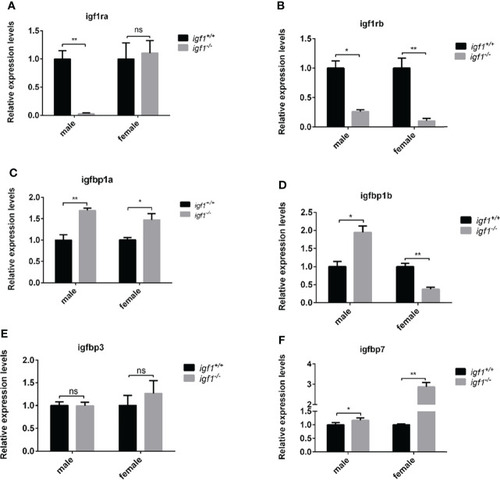
Transcriptional levels of igf1 related genes (A, B) Relative expression levels of igf1ra and igf1rb in igf1-deficient fish and the control wild-type fish and three biological repeats were carried out and statistical analysis was performed using a t test (n=3). (C–F) Relative expression levels of igfbp1a, igfbp1b, igfbp3 and igfbp7 in igf1-deficient fish and the control wild-type fish and three biological repeats were carried out and statistical analysis was performed using a t test (n=3). There was no difference between the two internal reference gene (β-actin and EF1α). Four animals were sampled for each experiment and three biological repeats were carried out and statistical analysis was performed using a t test (p<0.001, n=3). **P < 0.01.
|