
- Title
-
Strength of interactions in the Notch gene regulatory network determines patterning and fate in the notochord
- Authors
- Sánchez-Iranzo, H., Halavatyi, A., Diz-Muñoz, A.
- Source
- Full text @ Elife
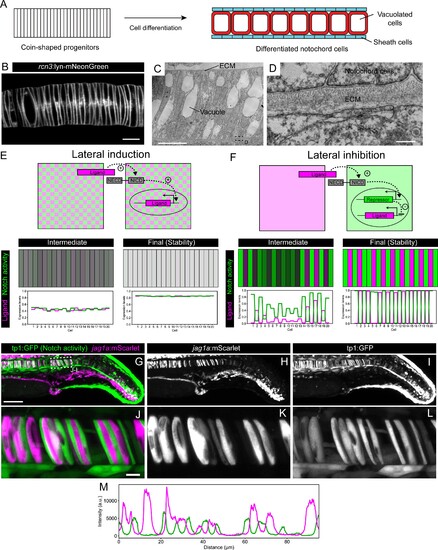
(A) Schematic representation of notochord development. At 18–19 hpf most of the notochord is composed of coin-shaped precursor cells. During the following 8 hours, progressively, in an antero-posterior order, coin-shaped precursor cells begin their differentiation into sheath cells and vacuolated cells. (B) Airyscan confocal section of a zebrafish notochord at 19 hpf using the rcn3:lyn-mNeonGreen transgenic line. (C) Transmission electron microscopy of a zebrafish notochord at 19 hpf. (D) Magnification of boxed area in (C). (E) (Top) Schematic representation of the model for a Lateral Induction Network shows a pair of cells where the ligand in one cell activates NICD release in the neighboring cell. NICD activates ligand expression in its own cell. (Bottom) Representative simulation of this network applied to an array of cells unidimensionally arranged. (F) (Top) Schematic representation of the model for a Lateral Inhibition Network shows a pair of cells where the ligand in one cell activates NICD release in the neighboring cell. NICD activates the expression of the repressor, which in turn inhibits ligand expression. (Bottom) Simulation of this network applied to an array of cells unidimensionally arranged. (G–L) Maximal intensity projection of Airyscan confocal sections of a zebrafish tail at 22 hpf. (J–L) Magnification of boxed area in (G). n = 10 fish. (L) Intensity profile across a horizontal line in panel (L). (M) jag1a:mScarlet and tp1:GFP expression levels across a 1 μm thick horizontal line on a single plane of the image shown in J. Scale bars, 1 μm (D) 10 μm (B, C, J), 100 μm (G). |
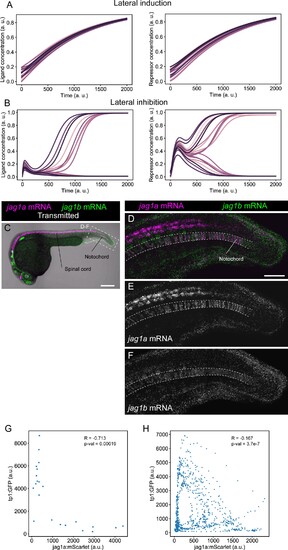
(A and B) Representative simulations of NICD and Ligand molecules in each cell for the lateral induction (A) and lateral inhibition (B) models. Each line represents a different cell. Related to models and simulations shown in Figure 1E and F. (C) Confocal projections of 24-hpf zebrafish stained with in situ HCR probes against jag1a (magenta) and jag1b (green). (D–F) Airyscan confocal projections at a higher magnification of boxed region in (C). n = 5 fish. (G) jag1a:mScarlet and tp1:GFP expression levels of each individual cell. Shown values are the mean intensity in a manually selected region of the cytoplasm of each independent cell on a single plane of the image shown in Figure 1J. Cells that are not labeled with jag1a:mScarlet or tp1:GFP cannot be distinguished, and were not included in the analysis. (H) Scatter plot of the intensities shown in Figure 1M. Pearson correlation and p-value of the correlation is shown in the plot. Scale bars, 200 μm (C) and 50 μm (D). |
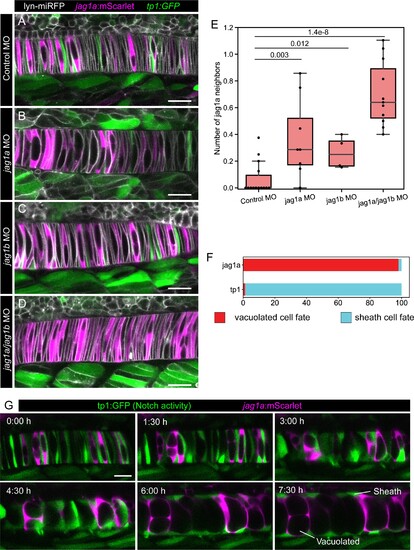
(A–D) jag1a:mScarlet tp1:GFP 21 hpf fish embryos injected with control MO (A), jag1a + control MO (B), jag1b + control MO (C), or control MO (D), together with lyn-miRFP mRNA to visualize membranes. (E) Quantification of the average number of jag1a-positive cells directly adjacent to each jag1a-positive cell. Two-tailed p-value is shown in the plot. (F) Cell fate of cells expressing jag1a or the tp1:GFP at the coin-shape stage. Quantifications from images as shown in G (standard deviation jag1a = 2.696, tp1 = 2.631; n = 5 fish). (G) Time lapse of optical sections of notochord cells using the tp1:GFP; jag1a:mScarlet double transgenic line. First frame corresponds to 24 hpf. Scale bars, 20μm. |
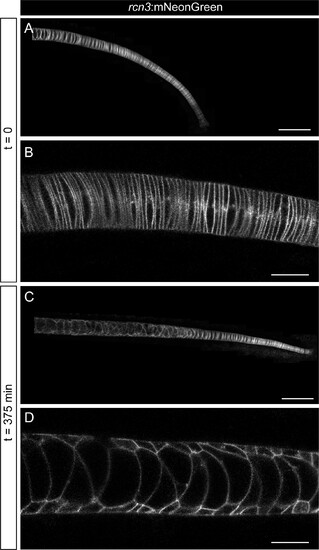
(A–D) In vivo time-lapse imaging of zebrafish notochords starting acquisition at 22 hpf using the rcn3:mNeonGreen transgenic line. Acquisition was based on a feedback microscopy protocol, where low quality images were first acquired and then analyzed at the time of acquisition to perform high zoom tile scan imaging only in the notochord cells. (A, C) show maximum projection of Airyscan confocal notochord reconstructions. (B, D) show zoomed images of single Airyscan confocal optical sections magnified from (A, C), respectively. Scale bars, 100 μm (A, C), and 20 μm (B, D).
|
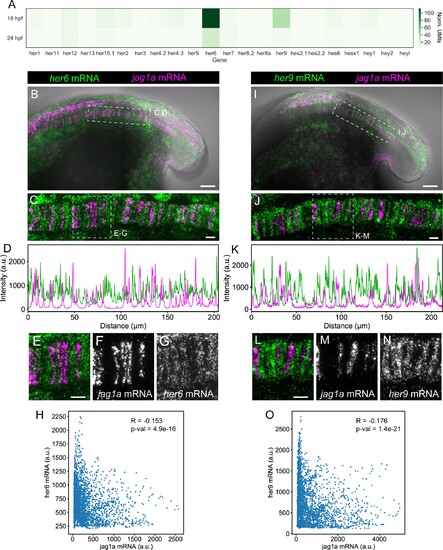
(A) Heatmap showing the expression levels of the zebrafish HES/HEY family genes. Values represent average normalized UMIs in all notochord cells at 18 and 24 hpf. (B) Projection of confocal optical sections of 18 hpf zebrafish stained with in situ HCR probes against her6 (green) and jag1a (magenta). Transmitted light is shown in gray scale. (C) Maximal projection of confocal Airyscan optical sections of the boxed area in (B). (D), Intensity profile of her6 (green) and jag1a (magenta) along a 1 μm thick horizontal line on the in situ HCR shown in (C). (E–G) Magnified views of boxed area in (C), n = 8. (H) Scatter plot of the intensities shown in D. Each point represents her6 and jag1a intensity in a 1-pixel width times 1 um height square. Pearson correlation and p-value of the correlation is shown in the plot. (I–O) Analogous images to (B–H) based on the her9 probe instead of her6 probe, n = 9. Scale bars, 50 μm (B, I), 20 μm (C, E, J, L). |
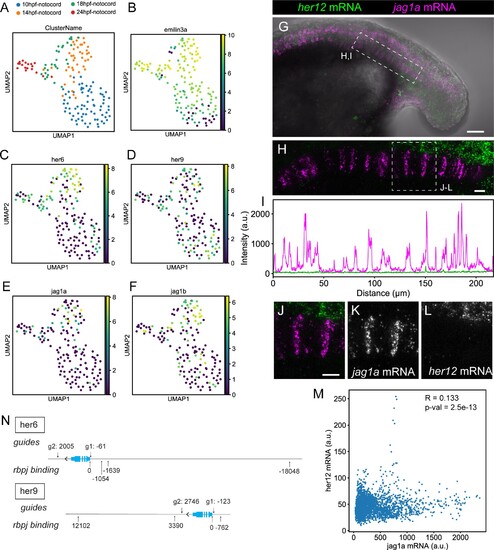
(A–F) UMAP plots showing notochord cells at 10, 14, 18, and 24 hpf. Cells are labeled depending on the developmental stage (A) or using a logarithmic color scale of of emilin3a, her6, her9, jag1a, and jag1b normalized expression (B–F). (G) Projection of confocal optical sections of 18 hpf zebrafish stained with in situ HCR probes against her12 (green) and jag1a (magenta). Transmitted light is shown in gray scale. (H) Maximal projection of confocal Airyscan optical sections of the boxed area in (G). (I) Intensity profile of her6 (green) and jag1a (magenta) along the notochord based on in situ HCR shown in (H). (J–M) Magnified views of boxed area in (H) n = 8. (M), Scatter plot of the intensities shown in (I). R represents Pearson’s correlation. (N) Guides used for her6 and her9 deletion and rbpj binding sites. Distances are represented as number of base pairs related taking the transcription start (TSS) site as cero. Only binding sites closer than 20 kb from the TSS are shown. Scale bars, 50 μm (G) 20 μm (H, J). |
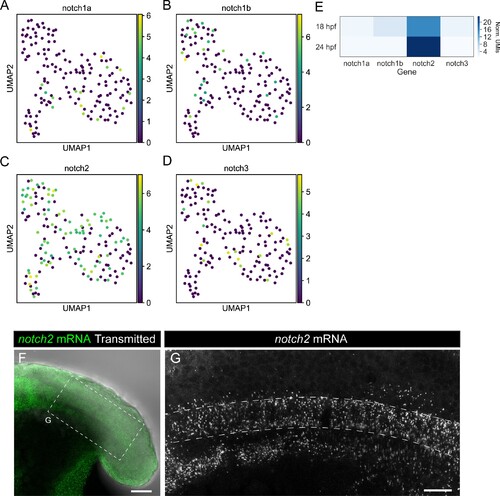
(A–D) UMAP plots showing notochord cells at 10, 14, 18, and 24 hpf. Cells are labeled based on a logarithmic color scale of notch1a (A), notch1b (B), notch2 (C) and notch3 (D) normalized expression. (E) Heatmap showing the expression levels of the Notch receptor genes. Values represent average normalized UMIs in all notochord cells at 18 and 24 hpf. (F) Projection of confocal optical sections of 18 hpf zebrafish stained with in situ HCR probe against notch2 (green). Transmitted light is shown in gray scale, n = 11. (G) Projection of confocal Airyscan optical sections of the boxed area in (F). Scale bars, 50 (F) 20 μm (G). |
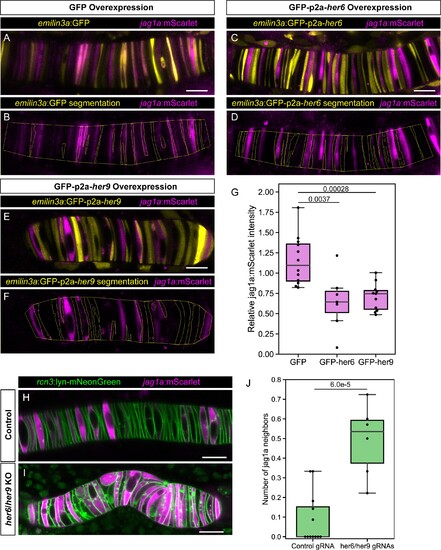
(A – E) Airyscan confocal optical sections of live 22 hpf transgenic jag1a:mScarlet zebrafish injected with emilin3a:GFP (A and B), emilin3a:GFP-p2a-her6 (C and D) or emilin3a:GFP-p2a-her9 (E and F). DNA constructs were injected at the one-cell stage together with I-SceI protein. (B, D, F) show the boundary of GFP segmentation in A, C, and E, respectively, and manual outline of the notochord. (G), Quantification of jag1a:mScarlet intensity inside GFP-positive cells segmented as exemplified in (B, D, F). Values in the plot represent the intensity of jag1a:mScarlet inside segmented cells divided by the jag1a:mScarlet intensity inside the notochord outside of the segmented cells. Each point represents an individual fish (n = 12 GFP, n = 7 GFP-p2a-her6, n = 11 GFP-p2a-her9). Two-tailed p-values are shown in the plot. (H), Airyscan confocal sections of embryo at 22 hpf injected with Cas9 together with a control guide (H) or Cas9 together with her6/her9 gRNAs (I). (J) Quantification of the average number of jag1a-positive cells directly adjacent to each jag1a-positive cell. For each individual fish, we count how many jag1a-positive cells are adjacent to each jag1a-postive cell, and then calculate the average for that fish. This value would be equal to 2 in case all the cells are jag1a-positive, and zero if no jag1a-positive cell is adjacent to another jag1a-positive cell. Each individual point in the plot represents the average value for an independent fish (n = 7 control, n = 8 her6/her9 KOs). Two-tailed p-value is shown in the plot. Scale bars, 20 μm. |
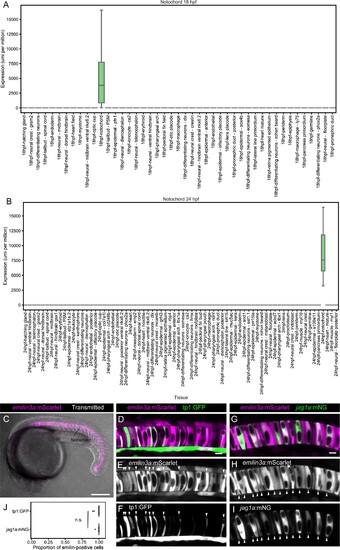
(A and B) Boxplot representing emilin3a expression in different tissues at 18 (A) and 24 hpf (B) according to single-cell transcriptomics. (C) Maximum projection of optical confocal sections of an emilin3a:mScarlet transgenic line at 21 hpf. Transmitted light is shown in gray scale. (D – I) Airyscan confocal optical sections of 21 hpf double transgenic emilin3a:mScarlet/tp1:GFP (D–F) or emilin3a:mScarlet/jag1a:mNeonGreen. Although at different intensities, emilin3a expression can be detected in most of the cells. Arrowheads point to the tp1:GFP- and jag1a:mNG-positive cells to facilitate their identification in the emilin3a:mScarlet channel. (J) 98% ± 3% of the tp1:GFP 99% ± 2% of the jag1a:mNeonGreen cells are emilin3a:mScarlet positive. Cells with an emilin3a:mScarlet signal that is more intense than the background were considered emilin3a:mScarlet-positive. Each dot represents an individual fish (n = 10 tp1:GFP, n = 6 jag1a:mNG). (n. s.) non-significant (0.67) differences by two-tailed t-test. Scale bars, 200 μm (C), 10 μm (D, G). |
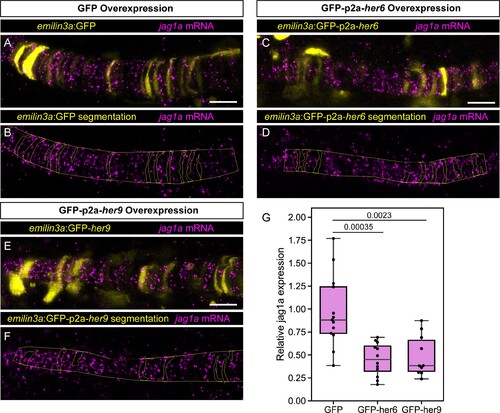
(A – F) Airyscan confocal optical sections of fixed 22 hpf transgenic injected with emilin3a:GFP (A and B), emilin3a:GFP-p2a-her6 (C and D) or emilin3a:GFP-p2a-her9 (E and F) constructs. GFP was detected by antibody staining and her6 and her9 mRNA by in situ HCR in whole mount embryos. (B, D, F) show the boundary of GFP segmentation in A, C, and E, respectively, and manual outline of the notochord. (G) Quantification of jag1a mRNA intensity inside GFP-positive cells segmented as exemplified in A-F. Each point represents an individual fish (n = 13 GFP, n = 12 GFP-her6, n = 10 GFP-her9). Scale bars, 20 μm. |
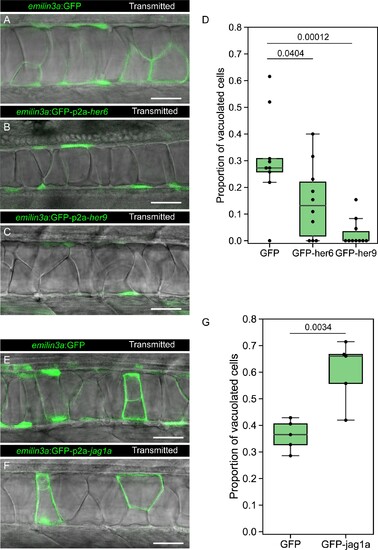
(A–C, E–F) Confocal optical sections of 2 dpf live zebrafish that were injected with the emilin3a:GFP (A, E) emilin3a:GFP-p2a-her6 (B), emilin3a:GFP-p2a-her9 (C) or emilin3a:GFP-p2a-jag1a (F) constructs. DNA constructs were injected at the one-cell stage together with I-SceI protein. (D and G) Proportion of vacuolated cells at 2 dpf are shown. Proportion of vacuolated cells was calculated by counting the number of vacuolated cells divided by the sum of the number of sheath and vacuolated cells. Each point in D, G represents an independent fish quantified from on z-stack confocal planes (D, n = 9 GFP, n = 10 GFP-her6, n = 10 GFP-her9, G, n = 5 GFP, n = 5 GFP-jag1a). Two-tailed p-values are shown in D and G. Scale bars, 50 μm. |

(A–B) Optical sections of 2 dpf zebrafish that were injected with the emilin3a:GFP or emilin3a:GFP-p2a-JICD constructs. (C) Proportion of vacuolated cells at 2 dpf. This proportion was calculated by counting the number of vacuolated cells divided by the sum of the number of sheath and vacuolated cells. Each point represents an independent fish quantified from on z-stack confocal acquisitions (n = 9 GFP, n = 6 GFP-jag1aICD). (n.s.) p-value > 0.05 by two-tailed t-test. Scale bars, 50μm. |
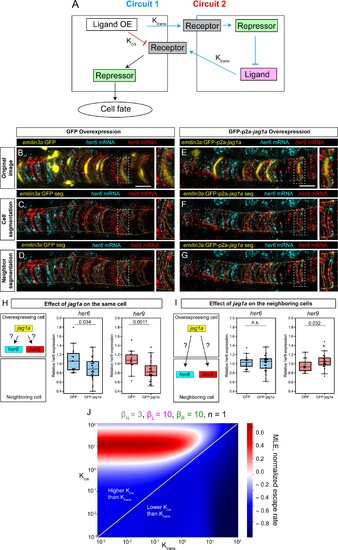
(A) Two possible circuits may explain the effect of jag1a on fate of the cell where jag1a is overexpressed. Circuit 1 is based on the interaction of ligand and receptor in trans. Circuit 2 is based on a possible role of cis-inhibition of the Notch receptor by the ligand. Cells where we overexpress the ligand are represented as the cell on the left. Adjacent cells are represented on the right. OE, overexpression. (B – G), Airyscan confocal planes of fixed 22 hpf transgenic fish injected with emilin3a:GFP (B–D) or emilin3a:GFP-p2a-jag1a (E–G) constructs. GFP was detected by antibody staining and her6 and her9 mRNA by in situ HCR in whole mount embryos. (C and F) show the notochord outline manually selected and the outline of GFP-positive cells automatically segmented. (D and G) show the outline of the manually selected notochord and the neighborhood to the GFP-positive cells. On the right side of each panel, a magnified view of the boxed region is shown. (H, I) Quantification of her6 and her9 mRNA expression after GFP-based segmentation as shown in (C, F) or (D, G), respectively. Values of her6 and her9 expression levels inside the segmented area inside the notochord were divided by the expression levels of the same genes in the region outside the segmented area, also inside the notochord. Each point represents a different fish. Two-tailed p-values are shown in the plots. n.s., non-significant. (J) Escape rates from the homogeneous steady state (indicated by Maximum Lyapunov Exponents, or MLE) as a function of Kcis and Ktrans parameters. Positive MLE values (red) support patterning, while negative MLE values (blue) do not. Scale bars, 20 μm. |

A) Schematic representation of a lateral inhibition model with mutual inhibition. Ligand binding to Notch receptor releases NICD, that activates Repressor expression. The repressor inhibits Ligand expression. In addition, when Notch receptor and Ligand are present in the same cell, they mutually inhibit to each other. (B) Representative simulation of the model shown in (A). |
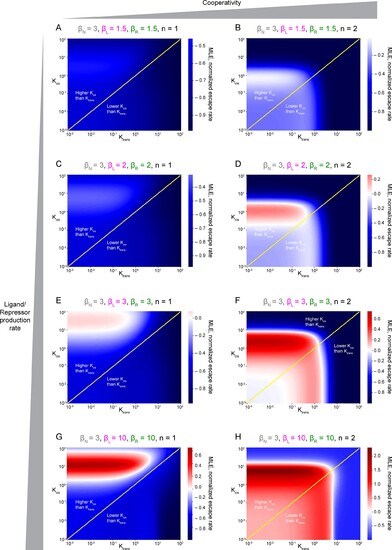
They are represented by Maximum Lyapunov Exponents, or MLE, as a function of Kcis and Ktrans parameters. Positive MLE values (red) support patterning, while negative MLE values (blue) do not. (A, C, E, G) Non-cooperativity. (B, D, E, H) Cooperativity. βN, production rate of Notch receptor; βL, production rate of Ligand, βR, production rate of receptor. Panel H has been duplicated from Figure 5J for easier comparison with the rest of plots.
|