
Fig. 2; supplement 1
- ID
- ZDB-IMAGE-220607-39
- Publication
- Sánchez-Iranzo et al., 2022 - Strength of interactions in the Notch gene regulatory network determines patterning and fate in the notochord
- All Figures
- Figures for Sánchez-Iranzo et al., 2022
|
Fig. 2; supplement 1
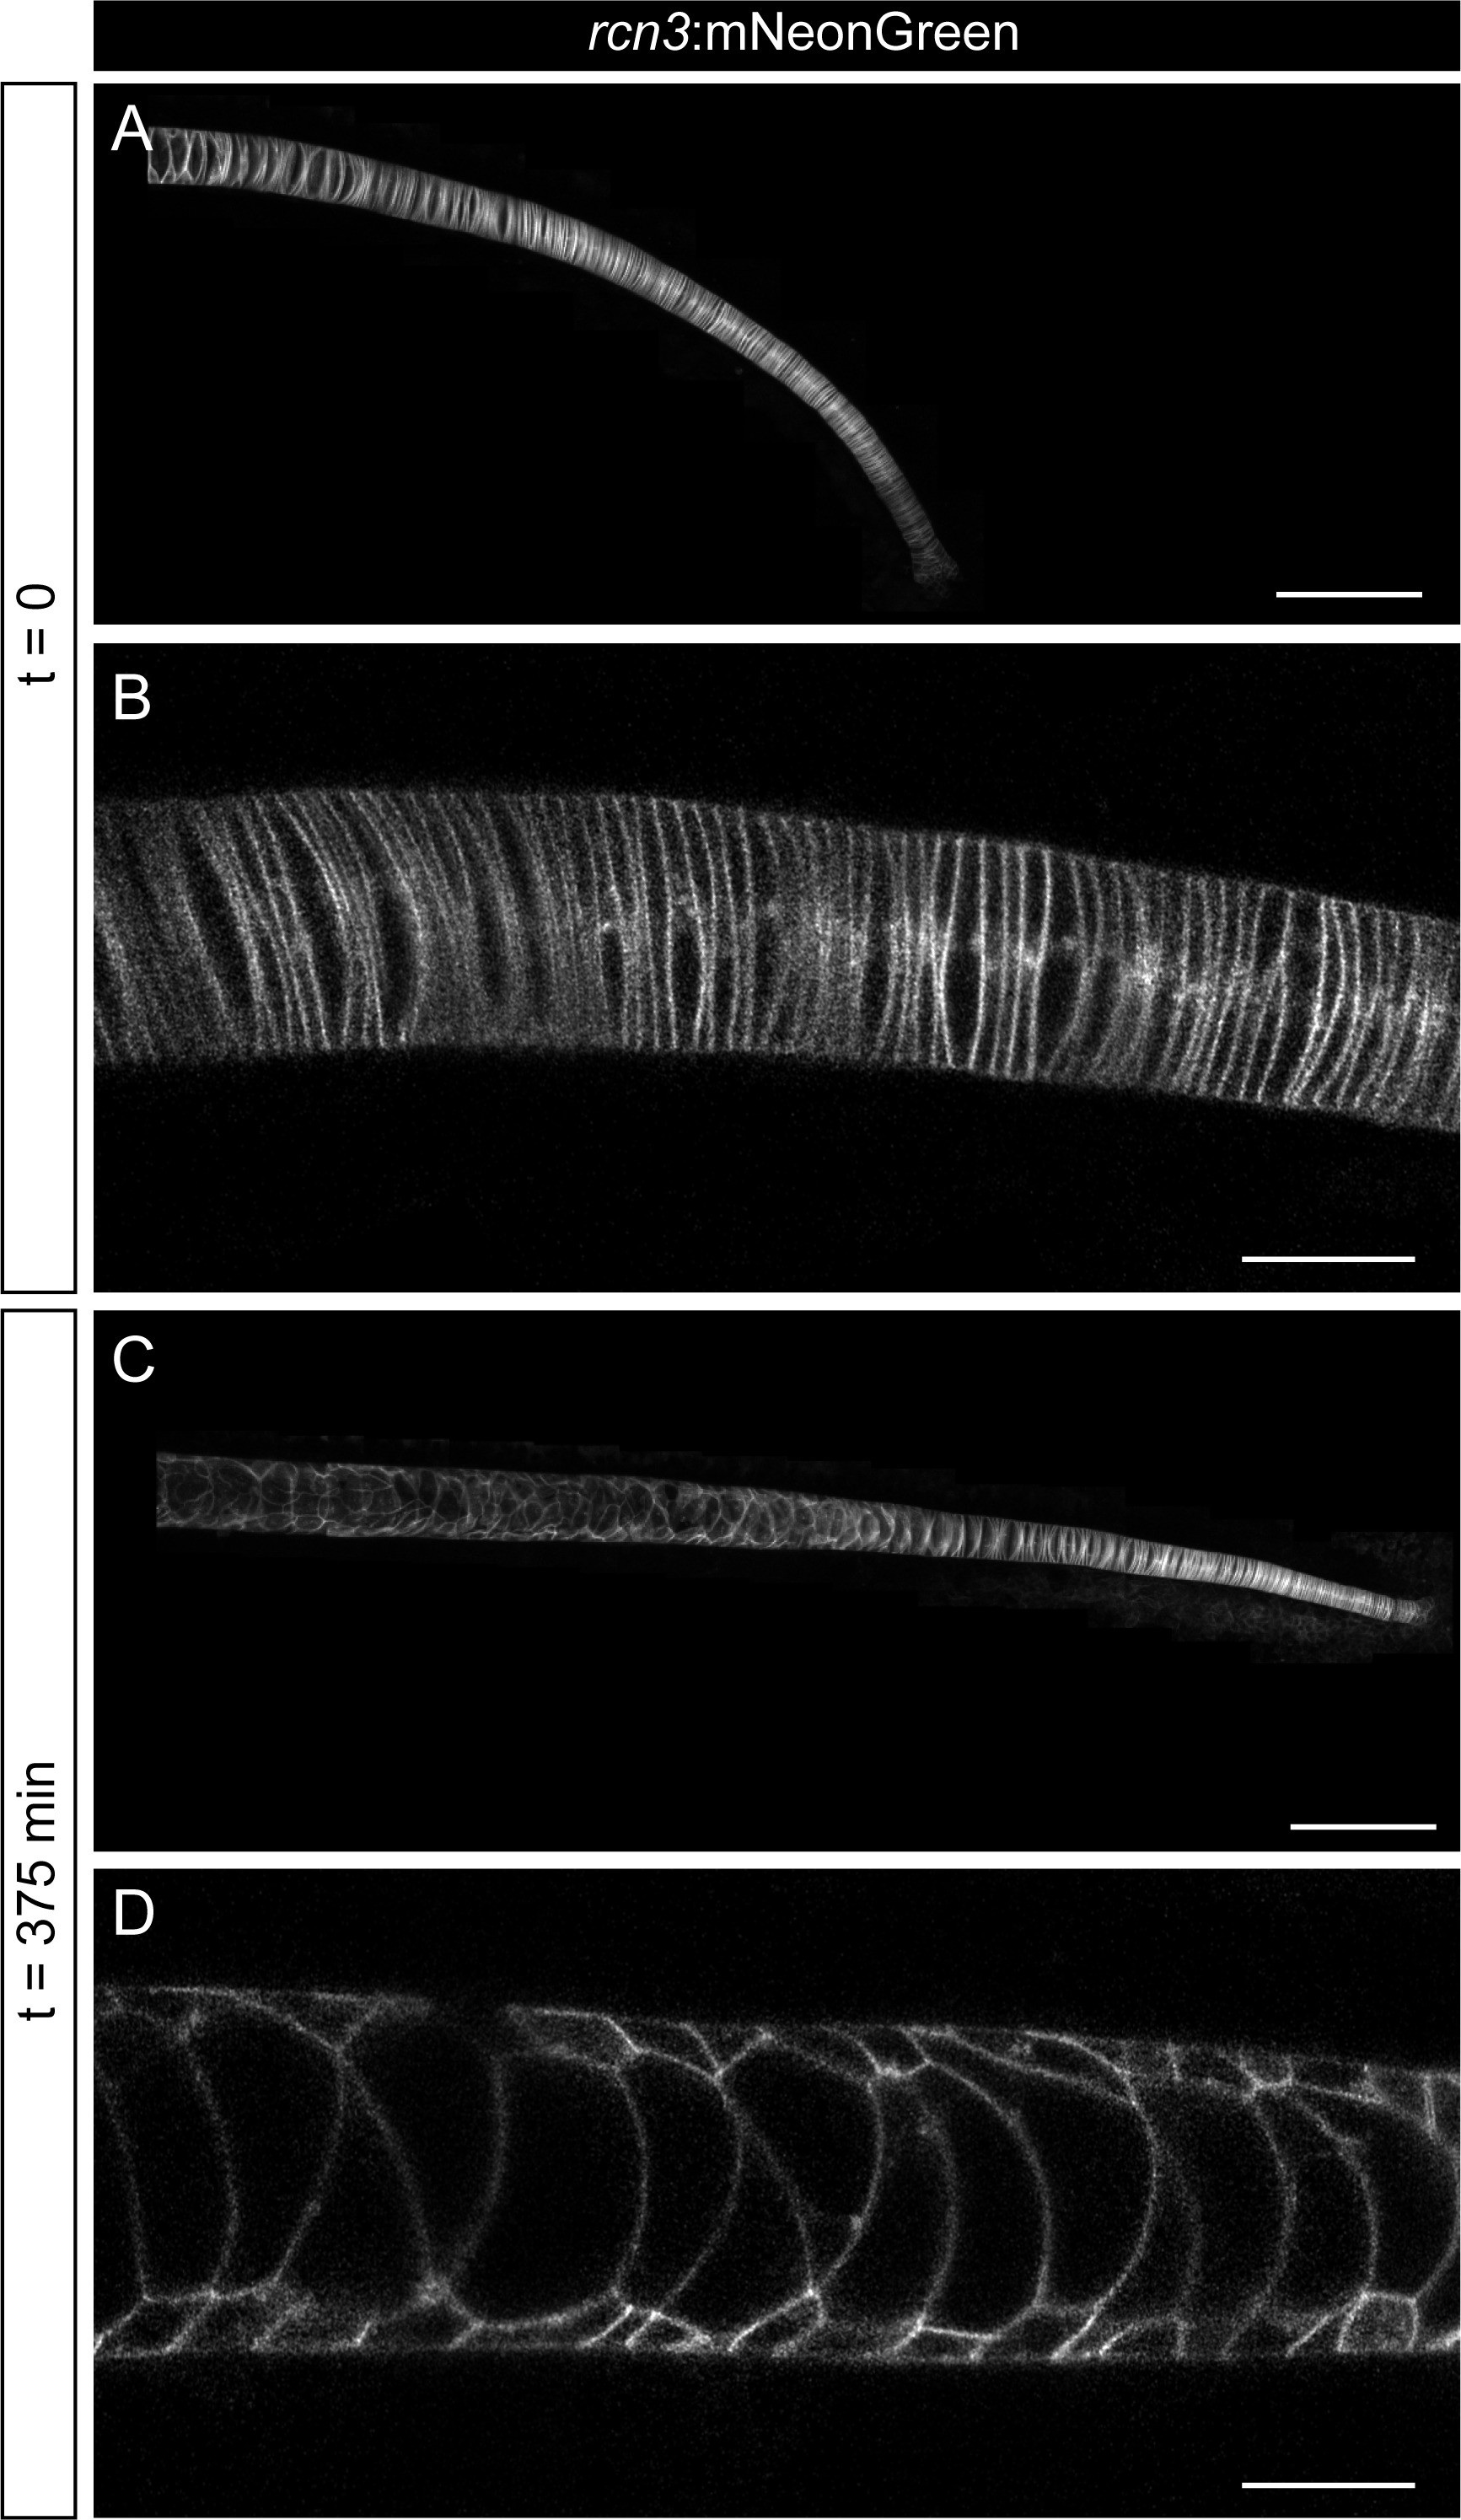
(A–D) In vivo time-lapse imaging of zebrafish notochords starting acquisition at 22 hpf using the rcn3:mNeonGreen transgenic line. Acquisition was based on a feedback microscopy protocol, where low quality images were first acquired and then analyzed at the time of acquisition to perform high zoom tile scan imaging only in the notochord cells. (A, C) show maximum projection of Airyscan confocal notochord reconstructions. (B, D) show zoomed images of single Airyscan confocal optical sections magnified from (A, C), respectively. Scale bars, 100 μm (A, C), and 20 μm (B, D).
In vivo imaging of notochord development.