
Fig. 3; supplement 1
- ID
- ZDB-FIG-220607-42
- Publication
- Sánchez-Iranzo et al., 2022 - Strength of interactions in the Notch gene regulatory network determines patterning and fate in the notochord
- Other Figures
- All Figure Page
- Back to All Figure Page
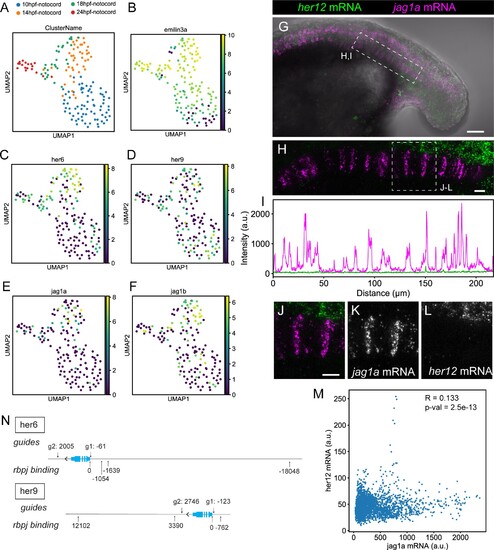
(A–F) UMAP plots showing notochord cells at 10, 14, 18, and 24 hpf. Cells are labeled depending on the developmental stage (A) or using a logarithmic color scale of of emilin3a, her6, her9, jag1a, and jag1b normalized expression (B–F). (G) Projection of confocal optical sections of 18 hpf zebrafish stained with in situ HCR probes against her12 (green) and jag1a (magenta). Transmitted light is shown in gray scale. (H) Maximal projection of confocal Airyscan optical sections of the boxed area in (G). (I) Intensity profile of her6 (green) and jag1a (magenta) along the notochord based on in situ HCR shown in (H). (J–M) Magnified views of boxed area in (H) n = 8. (M), Scatter plot of the intensities shown in (I). R represents Pearson’s correlation. (N) Guides used for her6 and her9 deletion and rbpj binding sites. Distances are represented as number of base pairs related taking the transcription start (TSS) site as cero. Only binding sites closer than 20 kb from the TSS are shown. Scale bars, 50 μm (G) 20 μm (H, J). |