
Fig. 3; supplement 2
- ID
- ZDB-FIG-220607-43
- Publication
- Sánchez-Iranzo et al., 2022 - Strength of interactions in the Notch gene regulatory network determines patterning and fate in the notochord
- Other Figures
- All Figure Page
- Back to All Figure Page
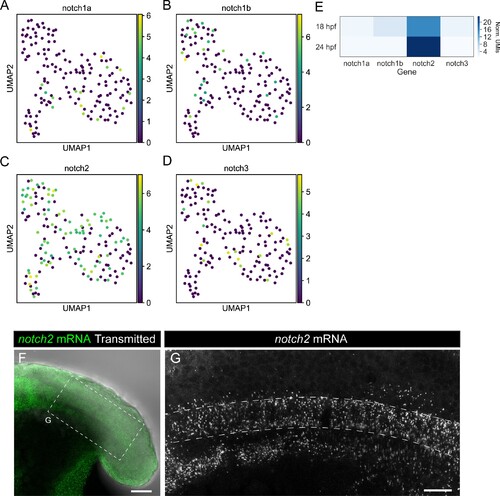
(A–D) UMAP plots showing notochord cells at 10, 14, 18, and 24 hpf. Cells are labeled based on a logarithmic color scale of notch1a (A), notch1b (B), notch2 (C) and notch3 (D) normalized expression. (E) Heatmap showing the expression levels of the Notch receptor genes. Values represent average normalized UMIs in all notochord cells at 18 and 24 hpf. (F) Projection of confocal optical sections of 18 hpf zebrafish stained with in situ HCR probe against notch2 (green). Transmitted light is shown in gray scale, n = 11. (G) Projection of confocal Airyscan optical sections of the boxed area in (F). Scale bars, 50 (F) 20 μm (G). |