
Fig. 6; supplement 2
- ID
- ZDB-IMAGE-220607-51
- Publication
- Sánchez-Iranzo et al., 2022 - Strength of interactions in the Notch gene regulatory network determines patterning and fate in the notochord
- All Figures
- Figures for Sánchez-Iranzo et al., 2022
|
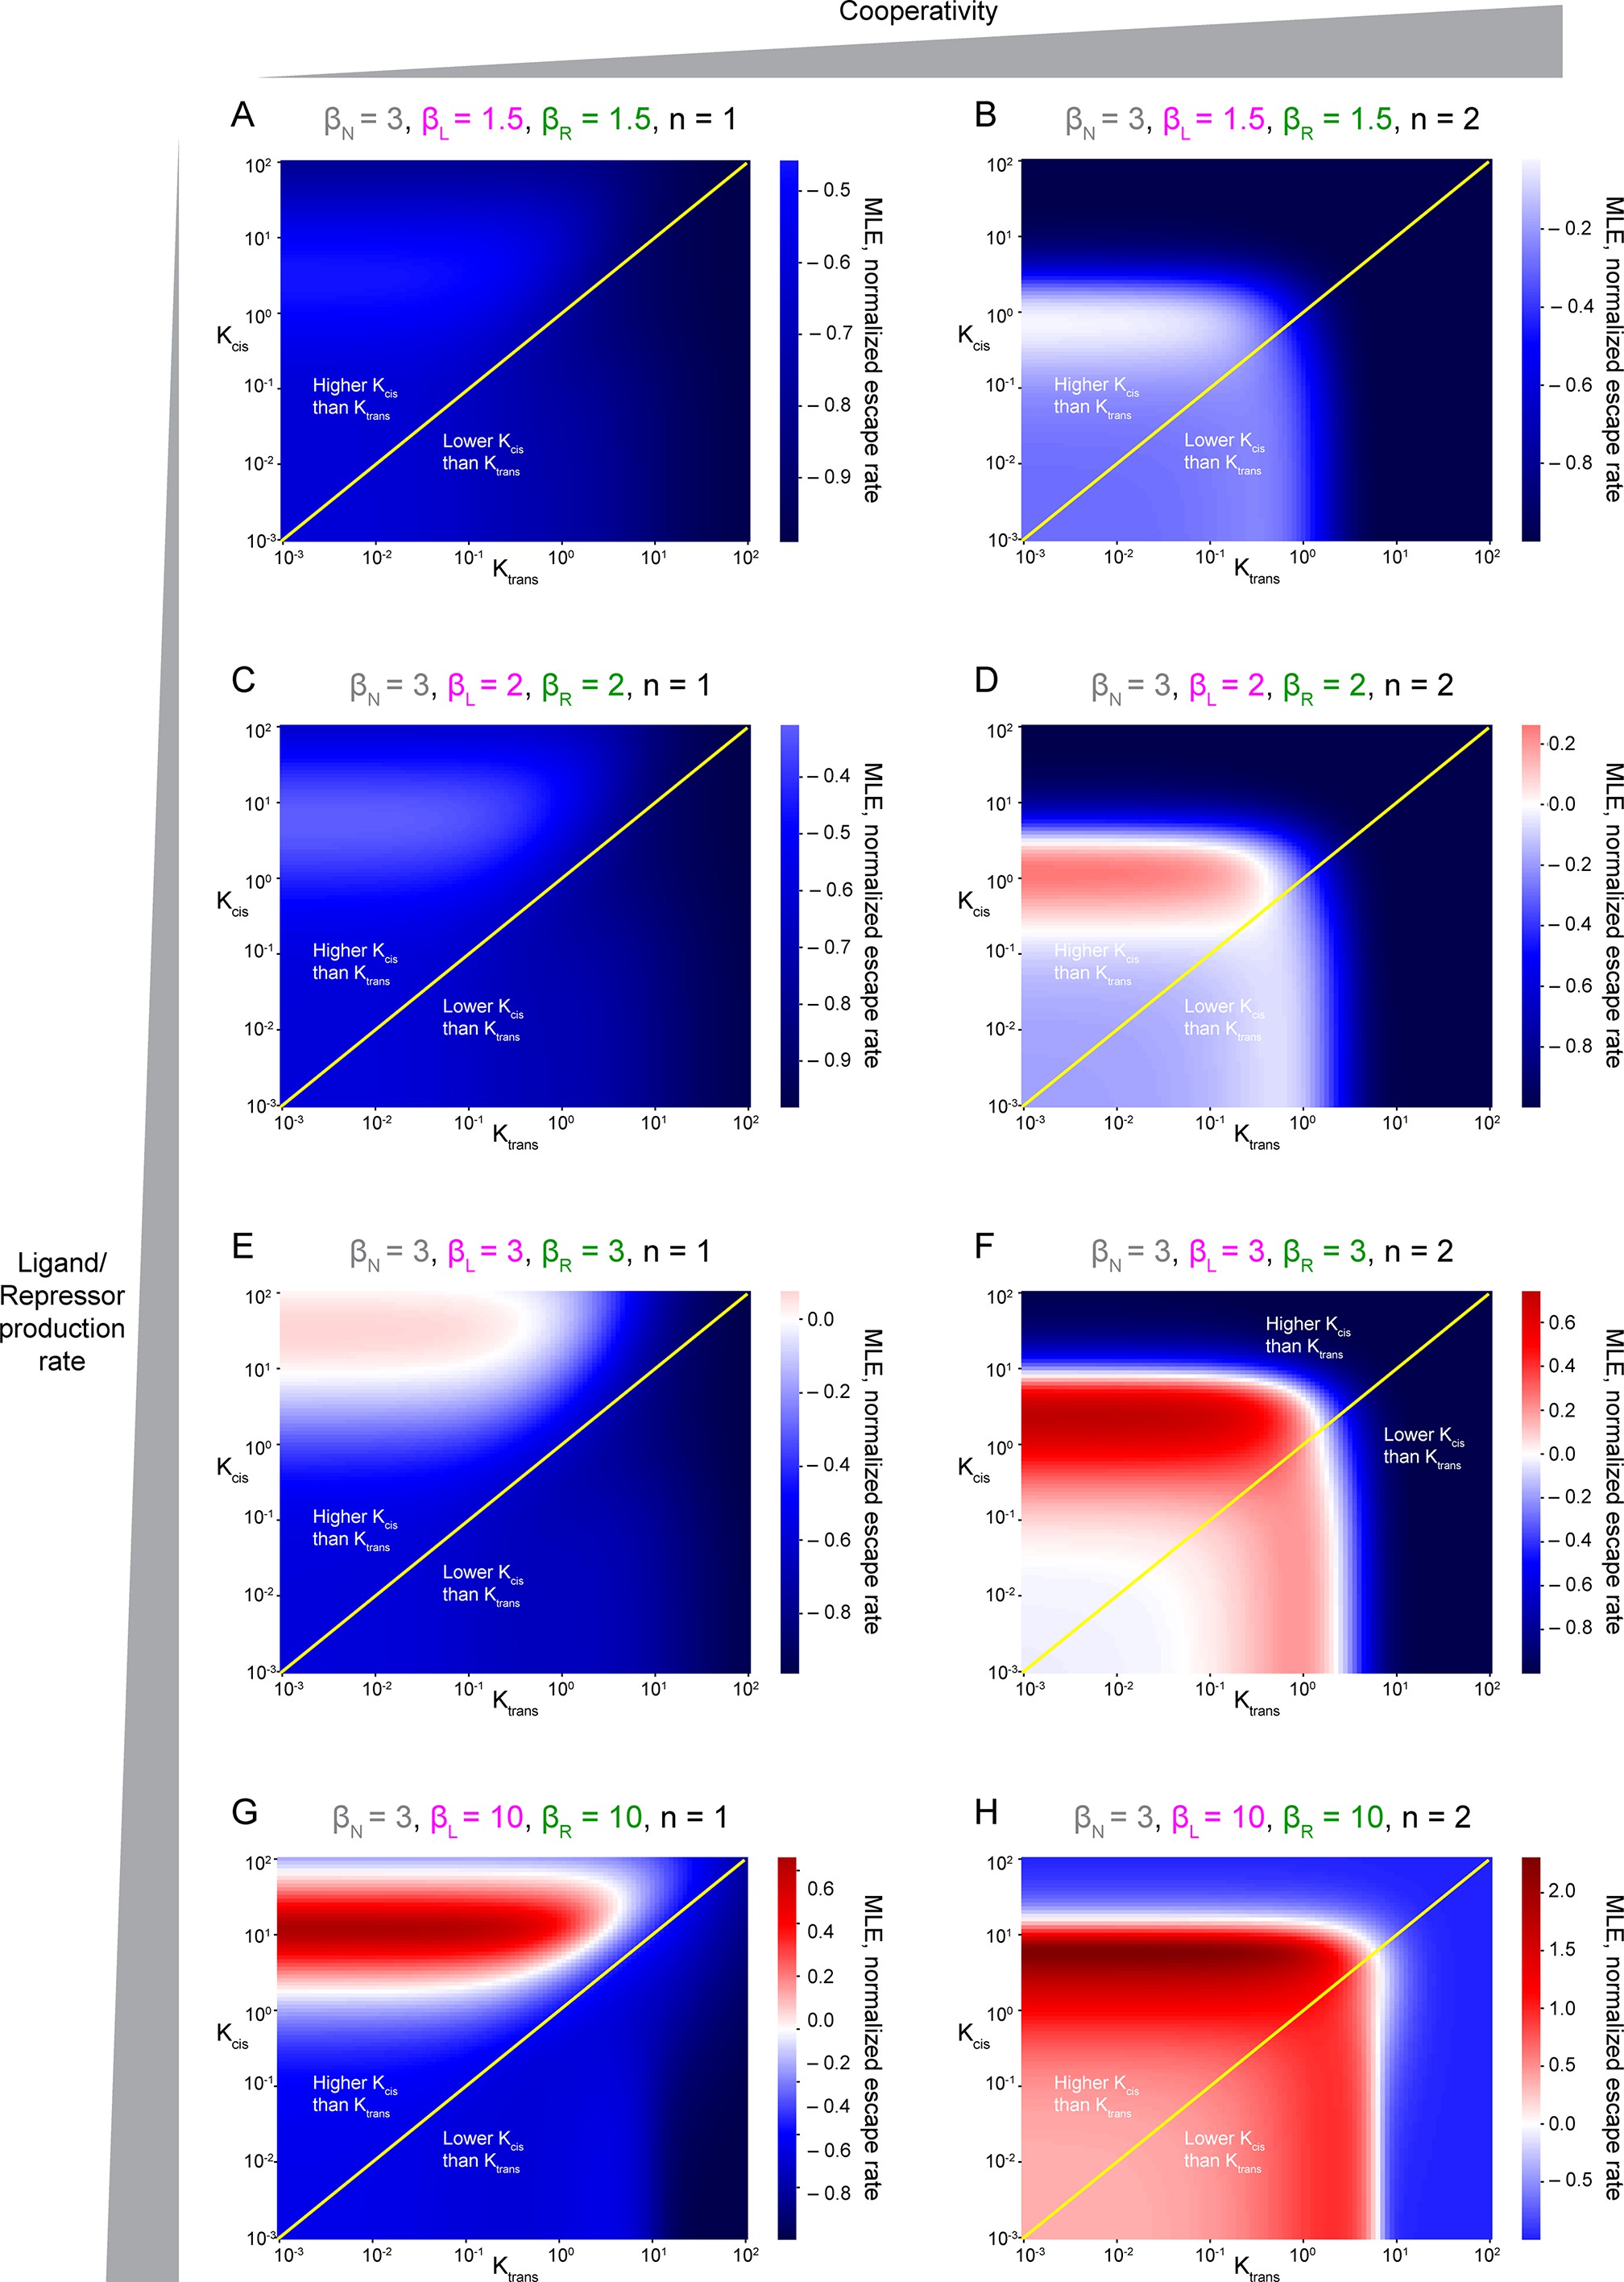
Fig. 6; supplement 2
They are represented by Maximum Lyapunov Exponents, or MLE, as a function of Kcis and Ktrans parameters. Positive MLE values (red) support patterning, while negative MLE values (blue) do not. (A, C, E, G) Non-cooperativity. (B, D, E, H) Cooperativity. βN, production rate of Notch receptor; βL, production rate of Ligand, βR, production rate of receptor. Panel H has been duplicated from Figure 5J for easier comparison with the rest of plots.
Escape rates from the homogeneous steady state.