
Fig. 3
- ID
- ZDB-FIG-220607-41
- Publication
- Sánchez-Iranzo et al., 2022 - Strength of interactions in the Notch gene regulatory network determines patterning and fate in the notochord
- Other Figures
- All Figure Page
- Back to All Figure Page
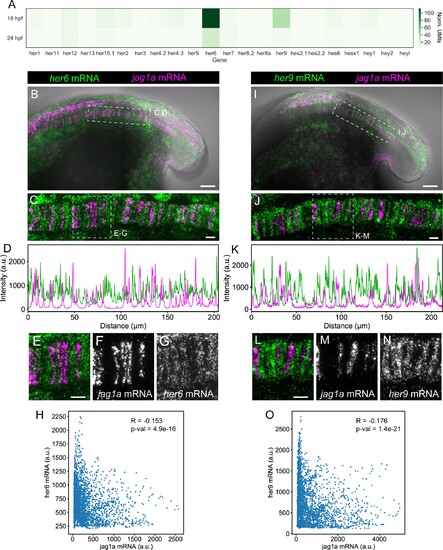
(A) Heatmap showing the expression levels of the zebrafish HES/HEY family genes. Values represent average normalized UMIs in all notochord cells at 18 and 24 hpf. (B) Projection of confocal optical sections of 18 hpf zebrafish stained with in situ HCR probes against her6 (green) and jag1a (magenta). Transmitted light is shown in gray scale. (C) Maximal projection of confocal Airyscan optical sections of the boxed area in (B). (D), Intensity profile of her6 (green) and jag1a (magenta) along a 1 μm thick horizontal line on the in situ HCR shown in (C). (E–G) Magnified views of boxed area in (C), n = 8. (H) Scatter plot of the intensities shown in D. Each point represents her6 and jag1a intensity in a 1-pixel width times 1 um height square. Pearson correlation and p-value of the correlation is shown in the plot. (I–O) Analogous images to (B–H) based on the her9 probe instead of her6 probe, n = 9. Scale bars, 50 μm (B, I), 20 μm (C, E, J, L). |