
Fig. 4; supplement 2
- ID
- ZDB-FIG-220607-46
- Publication
- Sánchez-Iranzo et al., 2022 - Strength of interactions in the Notch gene regulatory network determines patterning and fate in the notochord
- Other Figures
- All Figure Page
- Back to All Figure Page
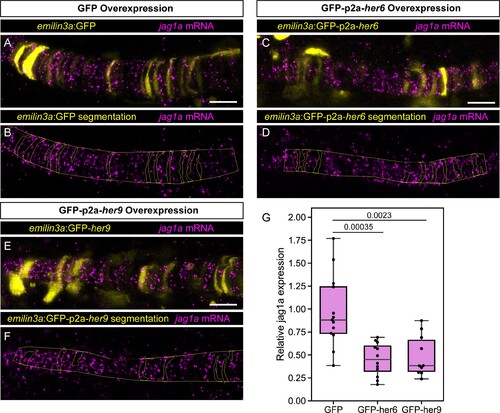
(A – F) Airyscan confocal optical sections of fixed 22 hpf transgenic injected with emilin3a:GFP (A and B), emilin3a:GFP-p2a-her6 (C and D) or emilin3a:GFP-p2a-her9 (E and F) constructs. GFP was detected by antibody staining and her6 and her9 mRNA by in situ HCR in whole mount embryos. (B, D, F) show the boundary of GFP segmentation in A, C, and E, respectively, and manual outline of the notochord. (G) Quantification of jag1a mRNA intensity inside GFP-positive cells segmented as exemplified in A-F. Each point represents an individual fish (n = 13 GFP, n = 12 GFP-her6, n = 10 GFP-her9). Scale bars, 20 μm. |