
Fig. 2
- ID
- ZDB-IMAGE-220607-38
- Publication
- Sánchez-Iranzo et al., 2022 - Strength of interactions in the Notch gene regulatory network determines patterning and fate in the notochord
- All Figures
- Figures for Sánchez-Iranzo et al., 2022
|
Fig. 2
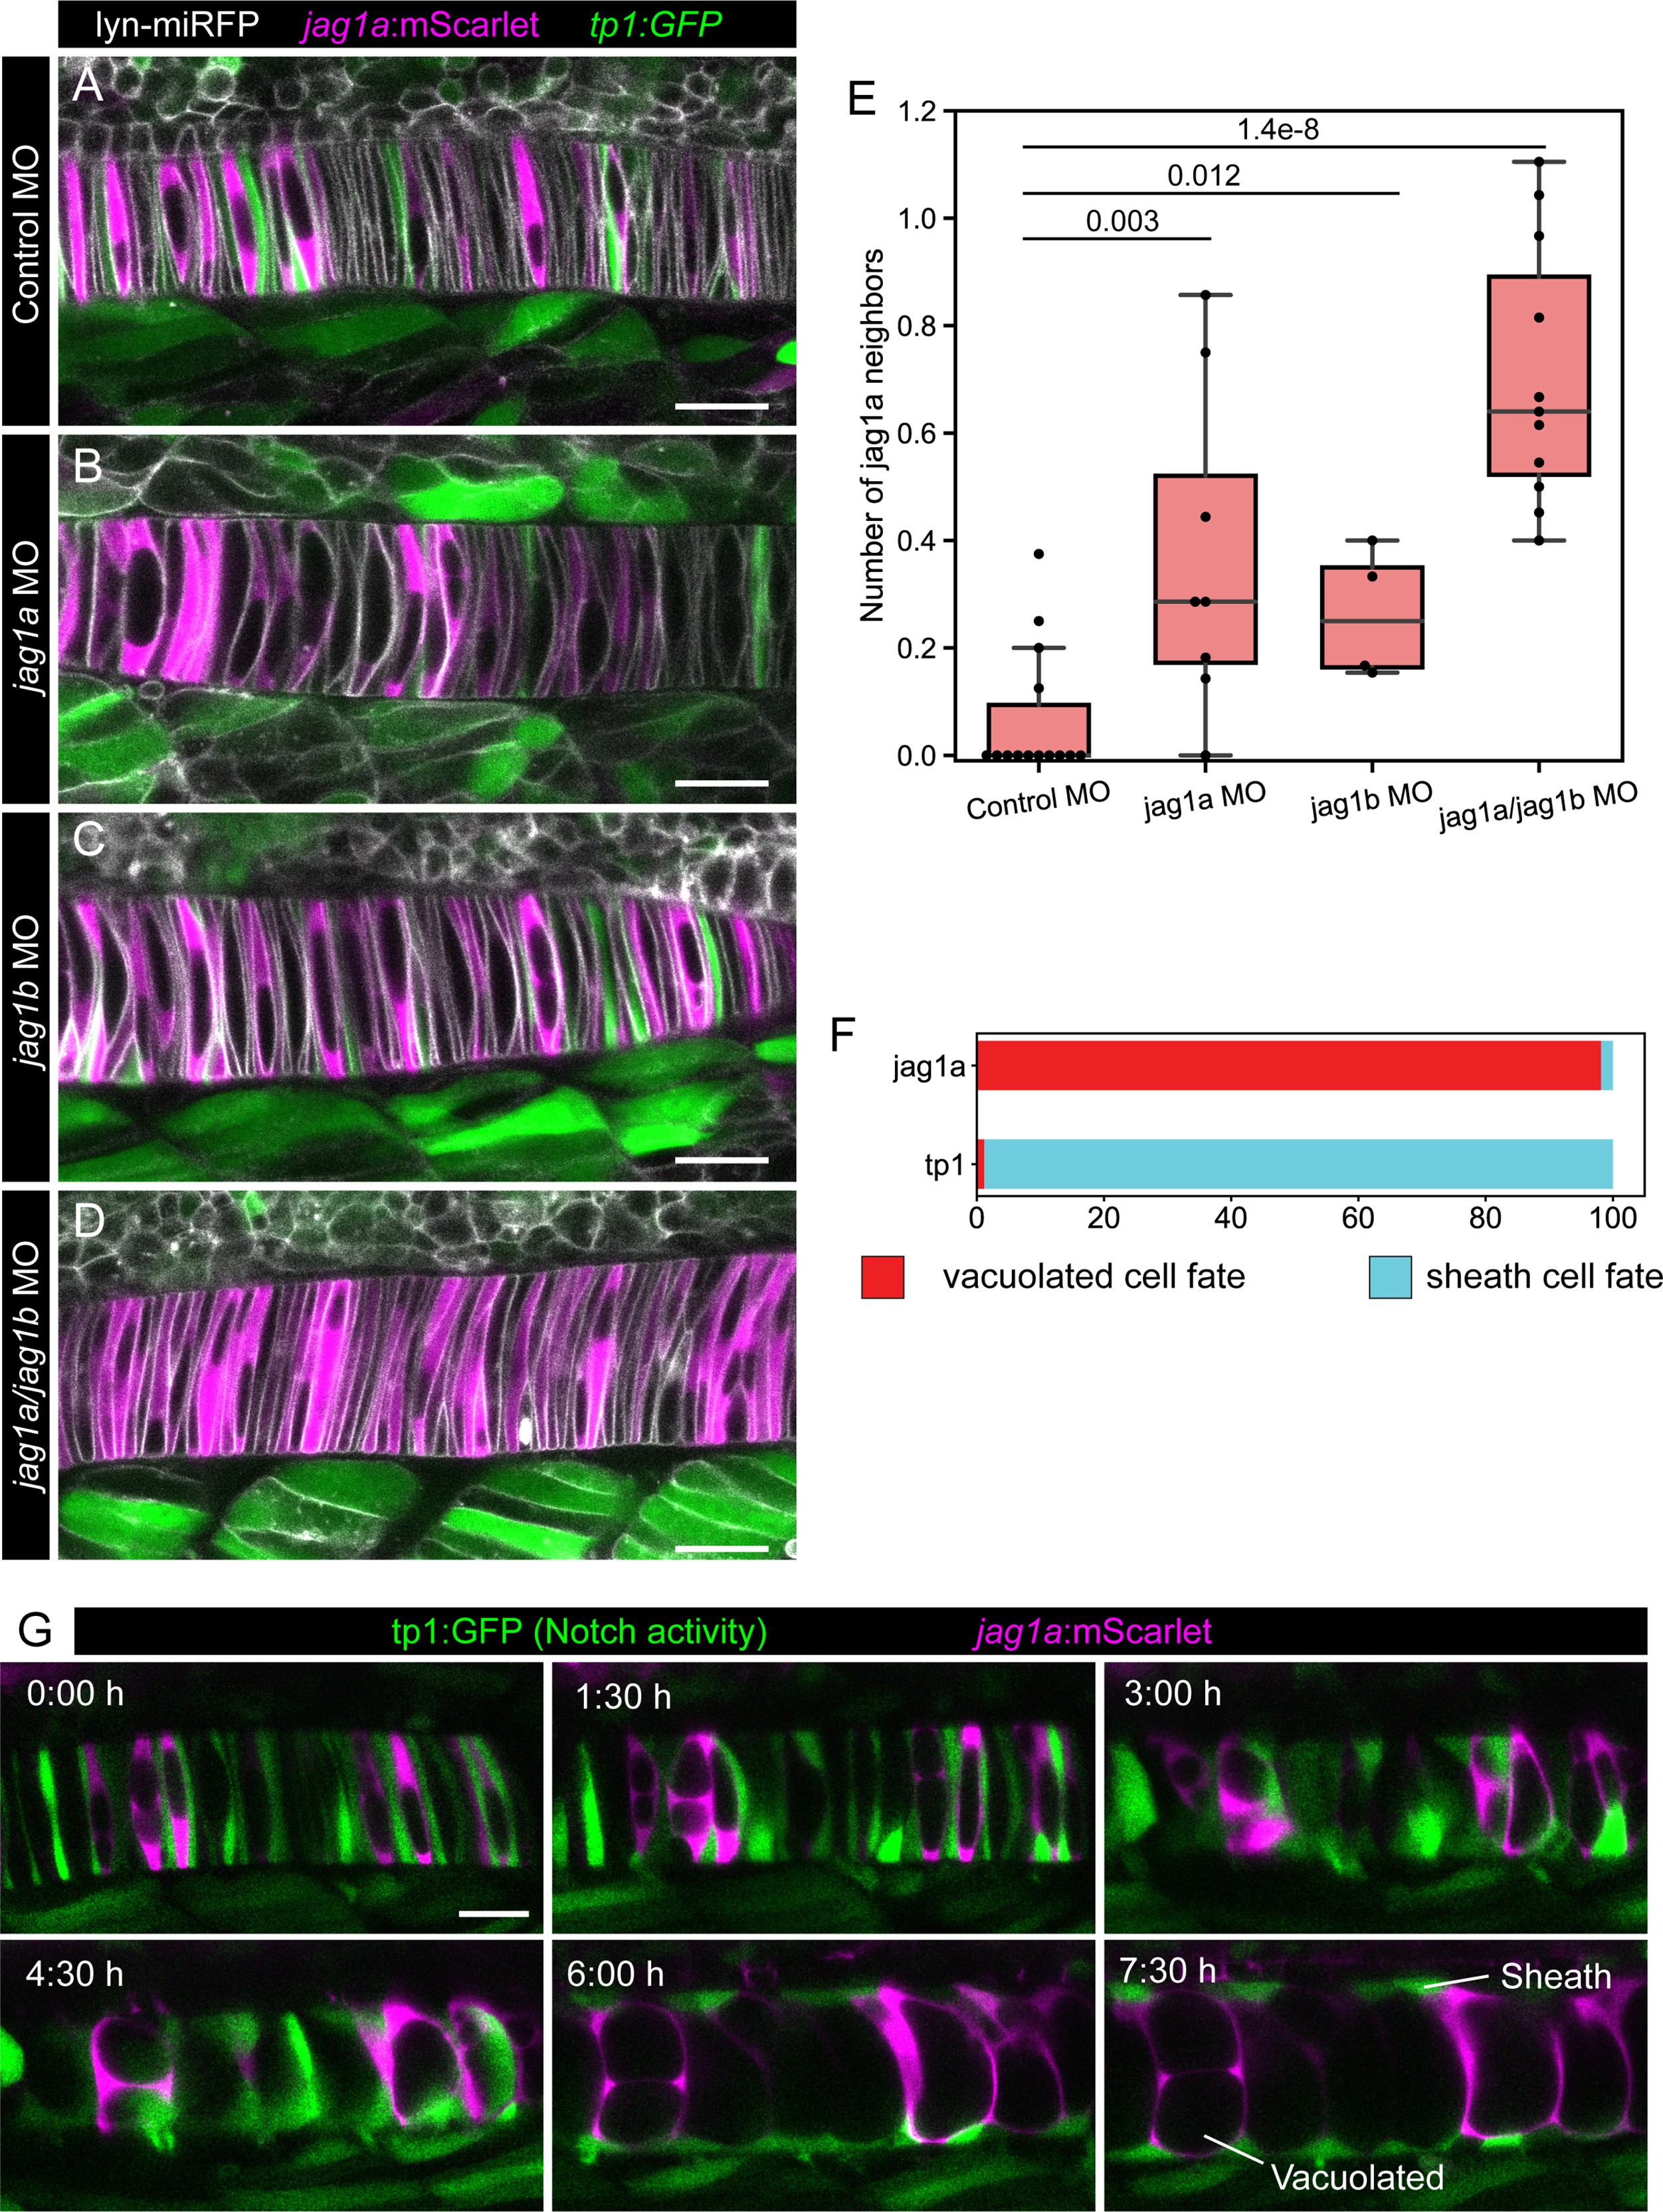
(A–D) jag1a:mScarlet tp1:GFP 21 hpf fish embryos injected with control MO (A), jag1a + control MO (B), jag1b + control MO (C), or control MO (D), together with lyn-miRFP mRNA to visualize membranes. (E) Quantification of the average number of jag1a-positive cells directly adjacent to each jag1a-positive cell. Two-tailed p-value is shown in the plot. (F) Cell fate of cells expressing jag1a or the tp1:GFP at the coin-shape stage. Quantifications from images as shown in G (standard deviation jag1a = 2.696, tp1 = 2.631; n = 5 fish). (G) Time lapse of optical sections of notochord cells using the tp1:GFP; jag1a:mScarlet double transgenic line. First frame corresponds to 24 hpf. Scale bars, 20μm.Jag1a/jag1b inhibition disrupts lateral inhibition pattern, and this pattern correlates with fate.