
Fig. 1: supplement
- ID
- ZDB-FIG-220607-38
- Publication
- Sánchez-Iranzo et al., 2022 - Strength of interactions in the Notch gene regulatory network determines patterning and fate in the notochord
- Other Figures
- All Figure Page
- Back to All Figure Page
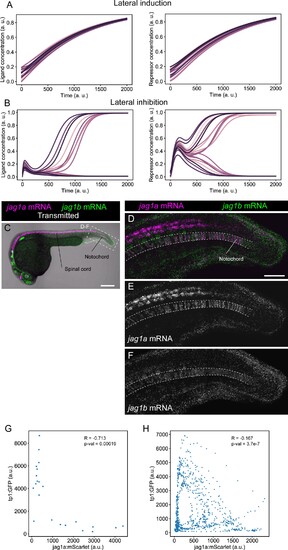
(A and B) Representative simulations of NICD and Ligand molecules in each cell for the lateral induction (A) and lateral inhibition (B) models. Each line represents a different cell. Related to models and simulations shown in Figure 1E and F. (C) Confocal projections of 24-hpf zebrafish stained with in situ HCR probes against jag1a (magenta) and jag1b (green). (D–F) Airyscan confocal projections at a higher magnification of boxed region in (C). n = 5 fish. (G) jag1a:mScarlet and tp1:GFP expression levels of each individual cell. Shown values are the mean intensity in a manually selected region of the cytoplasm of each independent cell on a single plane of the image shown in Figure 1J. Cells that are not labeled with jag1a:mScarlet or tp1:GFP cannot be distinguished, and were not included in the analysis. (H) Scatter plot of the intensities shown in Figure 1M. Pearson correlation and p-value of the correlation is shown in the plot. Scale bars, 200 μm (C) and 50 μm (D). |