
- Title
-
Accumulation of Lipid Droplets in a Novel Bietti Crystalline Dystrophy Zebrafish Model With Impaired PPARα Pathway
- Authors
- Gao, P., Jia, D., Li, P., Huang, Y., Hu, H., Sun, K., Lv, Y., Chen, X., Han, Y., Zhang, Z., Ren, X., Wang, Q., Liu, F., Tang, Z., Liu, M.
- Source
- Full text @ Invest. Ophthalmol. Vis. Sci.
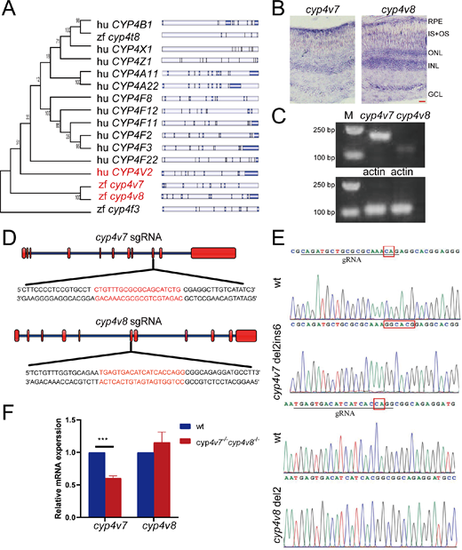
Generation of the cyp4v7 and cyp4v8 double knockout zebrafish. (A) Phylogenetic relationships and gene structures of CYP4 family genes in human and zebrafish. (B) In situ hybridization of cyp4v7 and cyp4v8 in retinas of two-month-old WT zebrafish. IS+OS, inner segment and outer segment; ONL, outer nuclear layer; INL, inner nuclear layer; GCL, ganglion cell layer. Scale bars: 20 µm. (C) Semiquantitative RT-PCR analysis of cyp4v7 and cyp4v8 expression in two-month-old zebrafish eyes. (D) CRISPR/Cas9 target sites. (E) DNA sequencing of the corresponding genomic region for WT and mutant zebrafish. The sequencing traces revealed a 2 bp deletion/6 bp insertion mutation in cyp4v7 and a 2 bp deletion mutation in cyp4v8. (F) Relative mRNA levels of cyp4v7 and cyp4v8 were detected by qPCR in WT and cyp4v7 and cyp4v8 double knockout zebrafish at 1 mpf. The results are shown as mean ± SD. ***P < 0.001. EXPRESSION / LABELING:
PHENOTYPE:
|
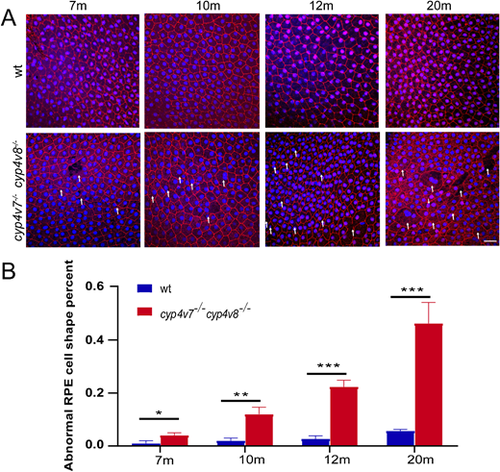
Abnormal morphologic characteristics of RPE cells in cyp4v7/cyp4v8 DKO zebrafish. (A) Immunofluorescence analysis of flat-mounted eyecups from WT and cyp4v7−/−cyp4v8−/− zebrafish at 7, 10, 12, and 20 months after fertilization using the anti-ZO-1 antibody. We defined the loss of hexagonal cellular architecture and junctional integrity cells as abnormal RPE cells. White arrows indicate the abnormal RPE cells. Scale bar: 20 µm. (B) The numbers of abnormal RPE cells were quantified for each of the images. The results are shown as mean ± SD. ***P < 0.001; **P < 0.01; *P < 0.05.
PHENOTYPE:
|
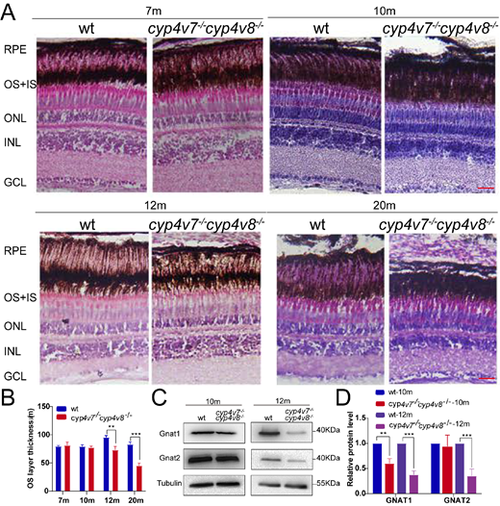
Lipid accumulation in RPE cells of WT and cyp4v7−/−cyp4v8−/− zebrafish. (A) Nile red staining of lipid droplets in retinal frozen sections of WT and cyp4v7−/−cyp4v8−/− zebrafish at 3, 7, 10, and 12 mpf. White arrows, lipid droplets. Scale bar: 20 µm. (B) Nile red staining of RPE flat mounts from WT and cyp4v7−/−cyp4v8−/− zebrafish at 3, 7, and 10 months after fertilization. White arrows, lipid droplets (bright red). Scale bar: 20 µm. Bar graphs show LD size distribution in cyp4v7−/−cyp4v8−/− zebrafish RPE flat mounts at 3, 7, and 10 months after fertilization. Diameter of LDs in cyp4v7−/−cyp4v8−/− zebrafish RPE cell was measured and represented by white (>3 μm), black (2-3 μm), red (1-2 μm), and blue (0-1 μm) (n = 88-103 RPE cells examined over three biologically independent experiments). (C) TEM images of retinal ultrathin sections from WT and cyp4v7−/−cyp4v8−/− zebrafish at seven months after fertilization. Lipid droplets are labeled with red text “LD”. Vacuoles are labeled with red text “V.”
PHENOTYPE:
|
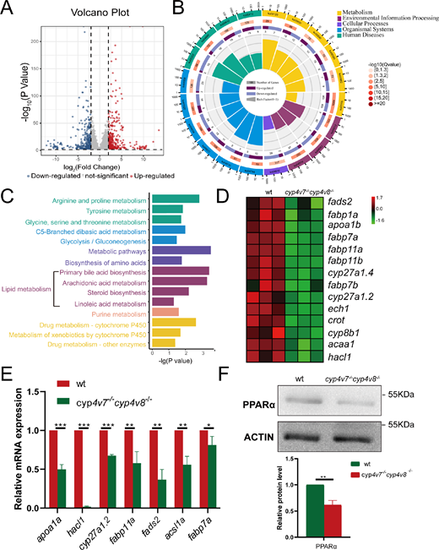
Downregulation of the PPARα pathway was involved in cyp4v7/cyp4v8 DKO zebrafish RPE cells. (A) Volcano plot of differentially expressed genes in cyp4v7−/−cyp4v8−/− zebrafish compared with WT. (B) KEGG circle enrichment analysis of the differentially expressed genes. The first lap indicates the top 20 KEGG terms. The second lap represents the gene numbers in the genome backdrop. The third circle represents the ratio of the upregulated genes (dark purple) and downregulated genes (light purple). The fourth circle represents the enrichment element of each KEGG term. (C) KEGG enriched metabolism pathways (P < 0.05) are shown. (D) Expression patterns of genes in PPARα signaling pathway in WT and cyp4v7−/−cyp4v8−/− zebrafish RPE cells are shown in the heatmap. (E) Validation of the expression of genes in PPARα pathway by qPCR in cyp4v7 and cyp4v8 DKO zebrafish RPE cells at seven months after fertilization. (F) Detection of the protein level of PPARα in WT and cyp4v7−/−cyp4v8−/− zebrafish RPE cells by Western blot. The results are shown as mean ± SD. ***P < 0.001; **P < 0.01; *P < 0.05.
|
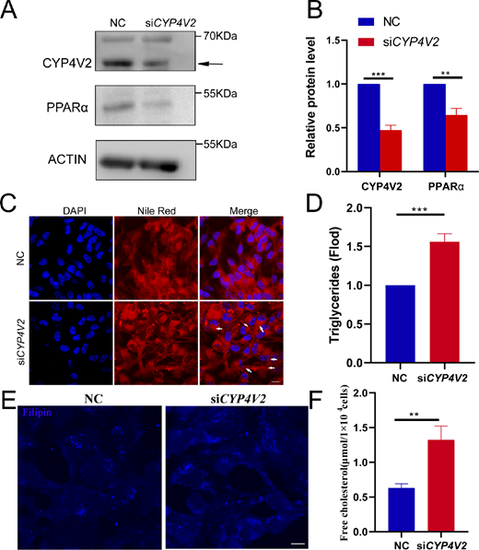
Knockdown of CYP4V2 increases LDs and free cholesterol accumulation in human RPE-1 cells. (A) Analysis of CYP4V2 and PPARα protein levels in negative control (NC) and siCYP4V2 RPE-1 cells by Western blotting. (B) Quantitative analysis of the Western blot data. At least three independent experiments were performed and quantified. The results are shown as mean ± SD. **P < 0.01. (C) Increased LDs in siCYP4V2 RPE-1 cells as revealed by Nile red staining. Scale bar: 10 µm. (D) Measurement of triglyceride concentrations in NC and siCYP4V2 RPE-1 cells. (E) Filipin staining in NC and siCYP4V2 RPE-1 cells. Scale bar, 10 µm. (F) Free cholesterol concentration in NC and siCYP4V2 RPE-1 cells. The results are shown as mean ± SD. ***P < 0.001; **P < 0.01.
|

ZFIN is incorporating published figure images and captions as part of an ongoing project. Figures from some publications have not yet been curated, or are not available for display because of copyright restrictions. PHENOTYPE:
|