
IMAGE
Fig. 4
- ID
- ZDB-IMAGE-220527-4
- Publication
- Gao et al., 2022 - Accumulation of Lipid Droplets in a Novel Bietti Crystalline Dystrophy Zebrafish Model With Impaired PPARα Pathway
- All Figures
- Figures for Gao et al., 2022
Image
|
Figure Caption
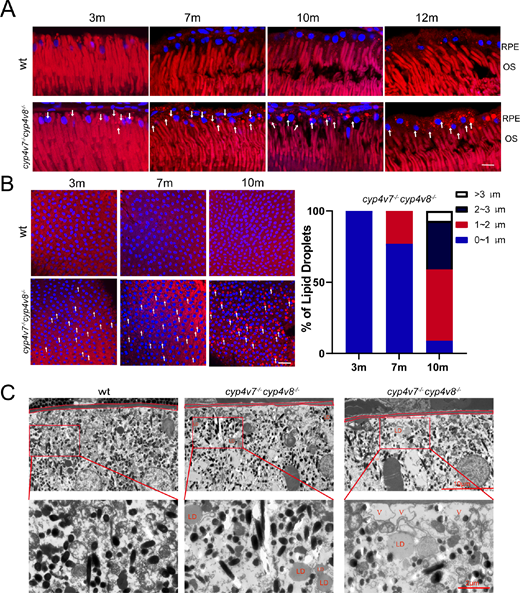
Fig. 4
Lipid accumulation in RPE cells of WT and cyp4v7−/−cyp4v8−/− zebrafish. (A) Nile red staining of lipid droplets in retinal frozen sections of WT and cyp4v7−/−cyp4v8−/− zebrafish at 3, 7, 10, and 12 mpf. White arrows, lipid droplets. Scale bar: 20 µm. (B) Nile red staining of RPE flat mounts from WT and cyp4v7−/−cyp4v8−/− zebrafish at 3, 7, and 10 months after fertilization. White arrows, lipid droplets (bright red). Scale bar: 20 µm. Bar graphs show LD size distribution in cyp4v7−/−cyp4v8−/− zebrafish RPE flat mounts at 3, 7, and 10 months after fertilization. Diameter of LDs in cyp4v7−/−cyp4v8−/− zebrafish RPE cell was measured and represented by white (>3 μm), black (2-3 μm), red (1-2 μm), and blue (0-1 μm) (n = 88-103 RPE cells examined over three biologically independent experiments). (C) TEM images of retinal ultrathin sections from WT and cyp4v7−/−cyp4v8−/− zebrafish at seven months after fertilization. Lipid droplets are labeled with red text “LD”. Vacuoles are labeled with red text “V.”
Figure Data
Acknowledgments
This image is the copyrighted work of the attributed author or publisher, and
ZFIN has permission only to display this image to its users.
Additional permissions should be obtained from the applicable author or publisher of the image.
Full text @ Invest. Ophthalmol. Vis. Sci.