
- Title
-
Structure-guided approach to relieving transcriptional repression in Resistance to Thyroid Hormone α
- Authors
- Romartinez-Alonso, B., Agostini, M., Jones, H., McLellan, J., Sood, D., Tomkinson, N., Marelli, F., Gentile, I., Visser, W.E., Schoenmakers, E., Fairall, L., Privalsky, M., Moran, C., Persani, L., Chatterjee, K., Schwabe, J.
- Source
- Full text @ Mol. Cell. Biol.

Location of human TRα mutations and WT TRα molecular switch. (A) Schematic representation of the full-length TRα, denoting the different functional domains of the receptor. Location of natural human mutations associated with RTHα (A382fs388X, F397fs406X, and E403X) and location of artificial mutation (P393GX) made for crystallization studies are indicated. (B) Structural model of TRα hormone-binding domain (PDB 2h79) in the unliganded state interacting with corepressor peptide (red) from the PPARα LBD:SMRT complex (PDB 1kkq) (left panel), and in the liganded state bound to coactivator peptide (blue) from the PPARα LBD:GRIP1 complex (PDB 1p54) (right panel). The position (A382, F397, E403) of natural human TRα mutations and the hydrogen bond between E403 and coactivator peptide are also shown. |
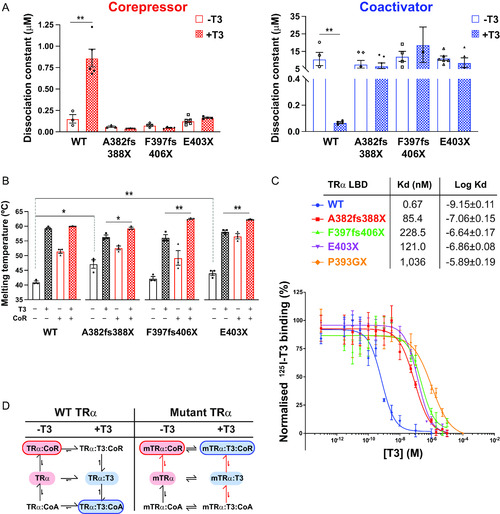
Interaction of human TRα mutants with corepressor and coactivator peptides (A) Binding affinities (dissociation constants) of wild-type and mutant TRα LBDs for corepressor in the absence (−T3) and presence (+T3) of T3 and for coactivator in the absence and presence of T3 in fluorescence anisotropy assays. Error bars indicate mean ± SEM (n = 5); **, P < 0.01. (B) Thermal stability (melting temperature) of wild-type and mutant TRα LBDs alone, in the presence of T3, with SMRT corepressor peptide, or with both SMRT and T3. Error bars indicate mean ± SEM (n = 5); *, P < 0.05; **, P < 0.01. (C) Radiolabeled T3 competitive binding assays of wild-type, mutant, and artificial mutant TRα showing the dissociation curves in the presence of increasing concentrations of unlabeled T3, and the dissociation constant (Kd) obtained. Data presented as mean ± SEM from two independent experiments performed in triplicate. (D) Scheme summarizing how the patient-derived mutations perturb the equilibria between ligand- and coregulator-bound species. |
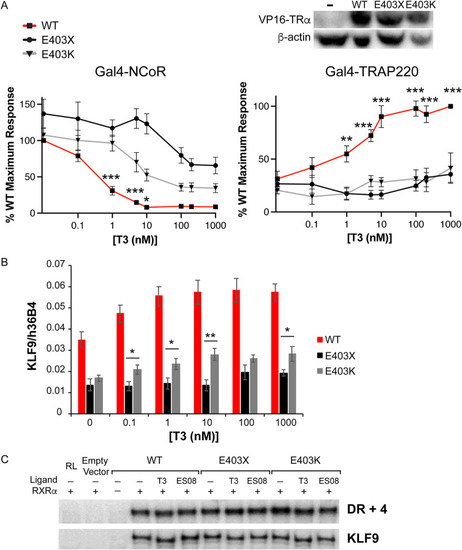
Comparison of the behavior of E403X and E403K mutant TRα receptors. (A) Two-hybrid assay to investigate the ability of ligand (T3) to dissociate NCoR and recruit TRAP220. *, P < 0.05; **, P < 0.01; ***, P < 0.001; ***, P < 0.0001 for comparisons of WT versus TRα mutants. (B) Analysis of KLF9 expression in patient-derived primary cells containing WT TRα or the E403X and E403K mutant TRα receptors. *, P < 0.05; **, P < 0.01 for comparisons of E403X versus E403K mutant TRα. (C) Electrophoretic mobility shift assays with WT, E403X or E403K mutant TRα, and RXR, with a canonical thyroid hormone response element (TRE) (DR + 4) or a known TRE in the human KLF9 promoter, in the presence of 1 μM T3 or 1 μM ES08. |
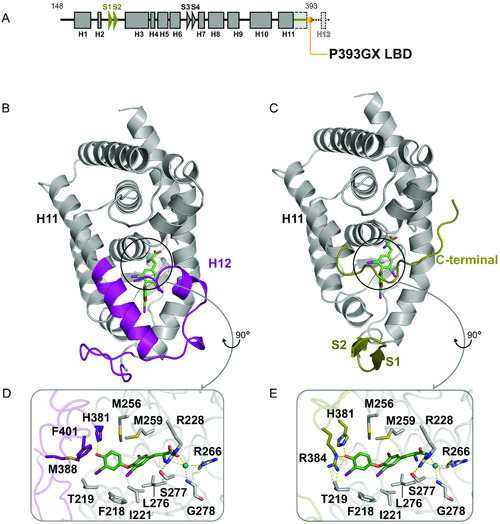
Comparison of wild-type and P393GX LBD structures. (A) Schematic representation of the P393GX LBD with alpha-helices (squares), beta-strands (arrowheads), and specific features of the P393GX mutant compared to the wild-type (highlighted in yellow). (B and C) Wild-type (B) and P393GX (C) LBD structures showing significantly different regions colored differently, with wild-type (purple) and P393GX (yellow). (D and E) Comparison of the wild-type (D) and P393GX (E) ligand-binding pockets, showing the different orientation of His 381 and different positions and interactions of Arg 384 residues. Key residues and helices are labeled with dashed lines denoting polar contacts. |

Characterization of P393GX LBD. (A) Corepressor binding assay of P393GX by fluorescence anisotropy showing saturating-binding curves and dissociation constant (Kd) of the P393GX binding to corepressor peptide in the absence and presence of T3. Error bars indicate mean ± SEM (n = 5). (B) Thermal stability (melting temperature) of P393GX in the apo form, with T3, with SMRT peptide, and with both T3 and SMRT peptide. (C) Purification of P393GX by GST and ion-exchange chromatography, illustrated via SDS-PAGE. (D) A 2F0-Fc electron density map contoured at 1.0 σ around the binding pocket of the protein, clearly showing T3 and the residues conforming the ligand binding pocket (structure deposited with PDB ID 7QDT). |

Effect of T3 and analogues on binding of wild-type and mutant TRα LBDs to corepressor. (A) Chemical structures of T3 analogues. Three series of novel T3 derivatives are shown. Each series contains an extension at the 4′ hydroxyl group of T3 linked with either an ether, ester, or sulfonate ester functional group. The extensions differ in size, hydrophobicity, and conformational flexibility. The JM ligands also have a carboxylic acid at the distal end of the extension. (B) Corepressor-binding affinity (dissociation constants) in fluorescence anisotropy assays (upper graphs) and thermal stability (melting temperature; bottom graphs) of wild-type and mutant TRα LBDs in the presence of T3 and different analogues. Anisotropy values were measured at each concentration of the protein:T3 analogue (molar ratio, 1:2) mixture to generate saturation-binding curves, from which the equilibrium dissociation constant of the interaction (Kd) was calculated. Error bars indicate ± SEM (n = 3); *P < 0.05 for comparisons of TRα mutants and T3 versus TH analogues. Melting temperatures of apo receptor proteins (blue) with either T3 (red) or T3 analogues (different colors), obtained by measuring changes in ellipticity of samples at 222 nm over a temperature range (20 to 90°C, 1-degree steps), are also shown. Error bars indicate mean ± SEM. (n = 3); *, P < 0.05; **, P < 0.01 for comparisons of TRα mutants and T3 versus TH analogues. |
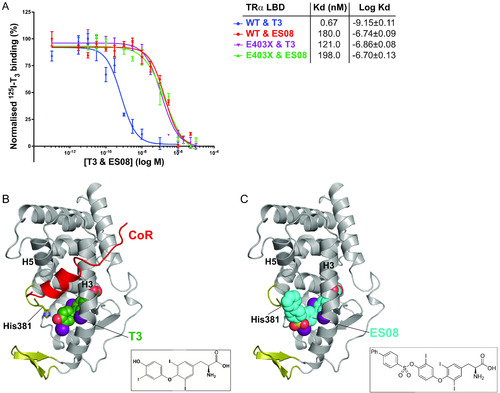
Binding affinity and fitting of ES08. (A) Competitive binding assay with radiolabeled T3, wild-type or mutant TRα, and increasing concentrations of unlabeled ES08, indicating dissociation constants (Kd) obtained. Data shown are the mean ± SEM from two independent experiments performed in triplicate. Note that the data for WT binding T3 is included for comparison, duplicated from Fig. 2C. (B) Model of corepressor binding to P393GX:T3 complex. T3 is shown in green with the SMRT corepressor peptide in red. Interaction of the LBD and corepressor peptides is mediated by corepressor recruitment in a hydrophobic groove formed by H3 and H5 of the LBD. Due to the lack of H12 in TRα mutants, there is no disruption of the CoR binding surface, and the corepressor remains interacting with the mutant receptors even in the presence of T3 forming the ternary complex. (C) Model of ES08 (cyan) binding to P393GX. Here, in contrast to T3, the extension at the 4′-hydroxyl of the outer thyronine ring potentially disrupts the CoR binding surface of the LBD and, consequently, ES08 interferes with corepressor interaction. |
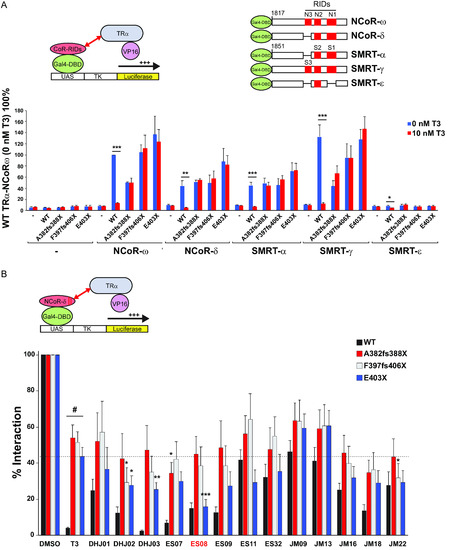
Interaction of VP16-TRα with GAL4-corepressor in mammalian cells. (A) Schematic representation of the cellular two-hybrid assay (left) and different human GAL4-corepressor isoforms (with locations of nuclear receptor interaction domains in red) tested (right). Below, this interaction of WT or mutant VP16-TRα fusions with different corepressor isoforms in the absence or presence of T3 is shown. Results are presented as mean ± SEM for at least 5 independent experiments performed in triplicate. *, P < 0.05; **, P < 0.01; ***, P < 0.001 for 0 nM T3 versus 10 nM T3 comparisons. (B) Interaction of GAL4-NCOR-δ with VP16-WT or mutant TRα fusions in the presence of vehicle (DMSO), 100 nM T3, or a different analogue. Results from at least 5 independent experiments are shown as percentages of interaction for WT or TRα mutants with NCoR-δ with vehicle. *, P < 0.05; **, P < 0.01; ***, P < 0.001 for comparisons of TRα mutants and T3 versus TRα mutants and analogue; #P < 0.001 for comparison of WT versus TRα mutants with 100-nM T3. |
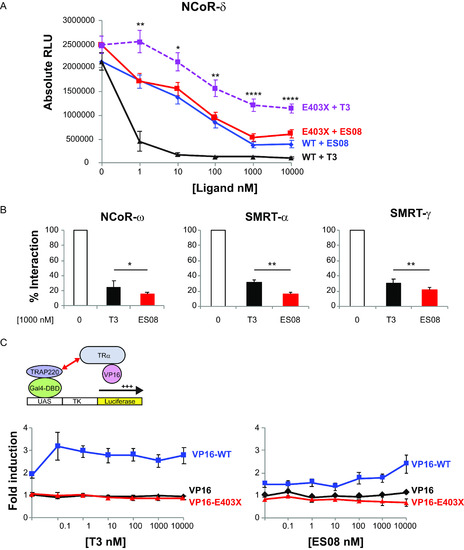
ES08 induces greater dissociation of corepressors from E403X mutant TRα than T3 does, but fails to recruit Gal4-TRAP220 coactivator in cellular protein interaction assays. (A) Dissociation of VP16-WT or VP16-E403X mutant TRα from GAL4-NCOR-δ with increasing concentrations (0 to 10,000 nM) of T3 or ES08. Results, shown as relative luciferase units (RLU) normalized to β-galactosidase activity, are given as the mean ± SEM of at least 5 independent experiments performed in triplicate. *, P < 0.05; **, P < 0.01; ***, P < 0.001; ****, P < 0.0001 for comparison of E403X plus T3 versus E403X plus ES08. (B) Interaction of VP16-E403X mutant TRα with different Gal4-corepressor isoform fusions in the absence of ligand (0), 1,000 nM T3, or ES08. Results from at least 5 independent experiments performed in triplicate are expressed as a percentage of WT TRα-corepressor interaction in the absence of T3. *, P < 0.05; **, P < 0.01 for comparison of E403X plus T3 versus E403X plus ES08. (C) Inability of VP16-E403X mutant TRα (red line) to recruit GAL4-TRAP220 coactivator fusion over a range (0 to 10,000 nM) of T3 or ES08 concentrations. The data are expressed as fold induction relative to cells transfected with Gal4-TRAP220 and VP16 alone and are shown as the mean ± SEM of at least 5 independent experiments each performed in triplicate. |
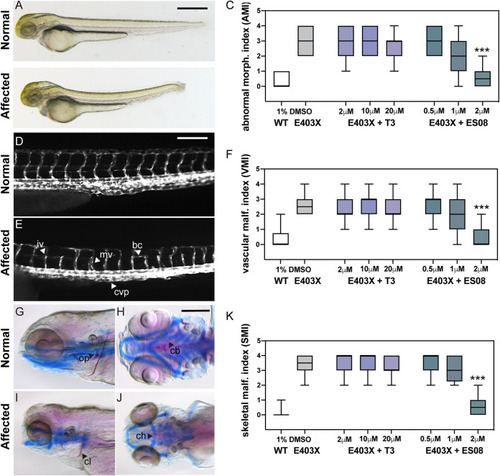
Effect of T3 and ES08 on E403X mutant TRα-expressing zebrafish embryos and E403X TRα mutation-containing, patient-derived inducible pluripotent stem cells. (A and B) Normal or abnormal morphology of embryos injected with hTRα WT or hTRα E403X mRNAs at 3 days postfertilization (dpf). Cerebral edema (ce), pericardial edema (pe), altered body curvature (bc), and thickening of caudal vein plexus (cvp) were used to calculate an abnormal morphology index (AMI, 0 = unaffected, 1 to 4 = affected). Scale bar = 250 μm. Boxplots of AMI for WT (open) or E403X injected zygotes treated with DMSO (gray), T3 (purple), or ES08 (gray-green) are shown in panel C. (D and E) transgenic tg(kdrl:EGFP) line was used to visualize normal or disrupted vascular architecture of the trunk-tail region of embryos at 4 dpf (lateral view, head to the left). Anomalies, including incomplete vessel (iv), aberrant branching (ab), misplaced vessel (mv), and reduced caudal vein plexus (cvp) area, shown in panel E, were used to calculate a vascular malformation index (VMI 0 = unaffected, 1 to 4 = affected). Scale bar = 50 μm. Boxplots of VMI of WT and E403X injected zygotes treated with DMSO (gray), T3 (purple), or ES08 (gray-green) are shown in panel F. (G to J) Normal or defective cranial cartilage development and bone mineralization in 5 dpf embryos stained with Alcian Blue (in blue) and Alizarine (in red), respectively. Absent or reduced mineralization of cleitrum (cl) and operculum (op) (visible in lateral view), and malformations of ceratohyal (ch) and the five ceratobranchial (cb) arches of cartilages (visible in ventral view) were quantified to compute a skeletal malformation index (SMI). Scale bar = 100 μm. (K) Box plots of SMI of WT and E403X mutant TRα-expressing embryos following exposure to DMSO, T3, or ES08. Indices shown are mean ± SEM for pools of 60 embryos per condition, from at least 4 independent experiments. P < 0.001 (***) for comparison of malformation indices in E403X TRα-expressing embryos after exposure to DMSO versus exposure to ES08. EXPRESSION / LABELING:
PHENOTYPE:
|
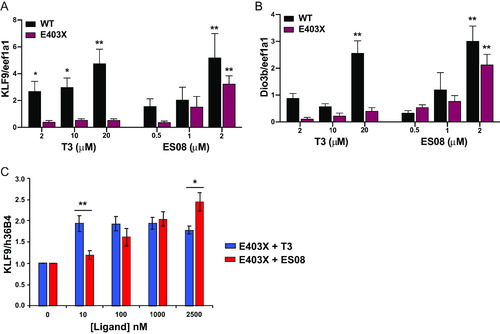
In vivo analysis of TRα target genes. (A and B) Expression of thyroid hormone receptor target genes (KLF9 and Dio3b) in WT and E403X mutant TRα-injected zygotes exposed to vehicle (DMSO), T3, or ES08. Results are expressed as fold changes versus DMSO-treated cells. *, P < 0.05; **, P < 0.01 for comparison with vehicle-treated embryos. (C) Expression KLF9 (a thyroid hormone receptor target gene) in inducible pluripotent stem cells derived from patient harboring an E403X TRα mutation, with increasing concentrations of T3 or ES08 analogue. Results are expressed as fold changes versus nontreated cells: *, P < 0.05; **, P < 0.01 for comparison of E403X with T3 versus E403X with ES08. |