
|
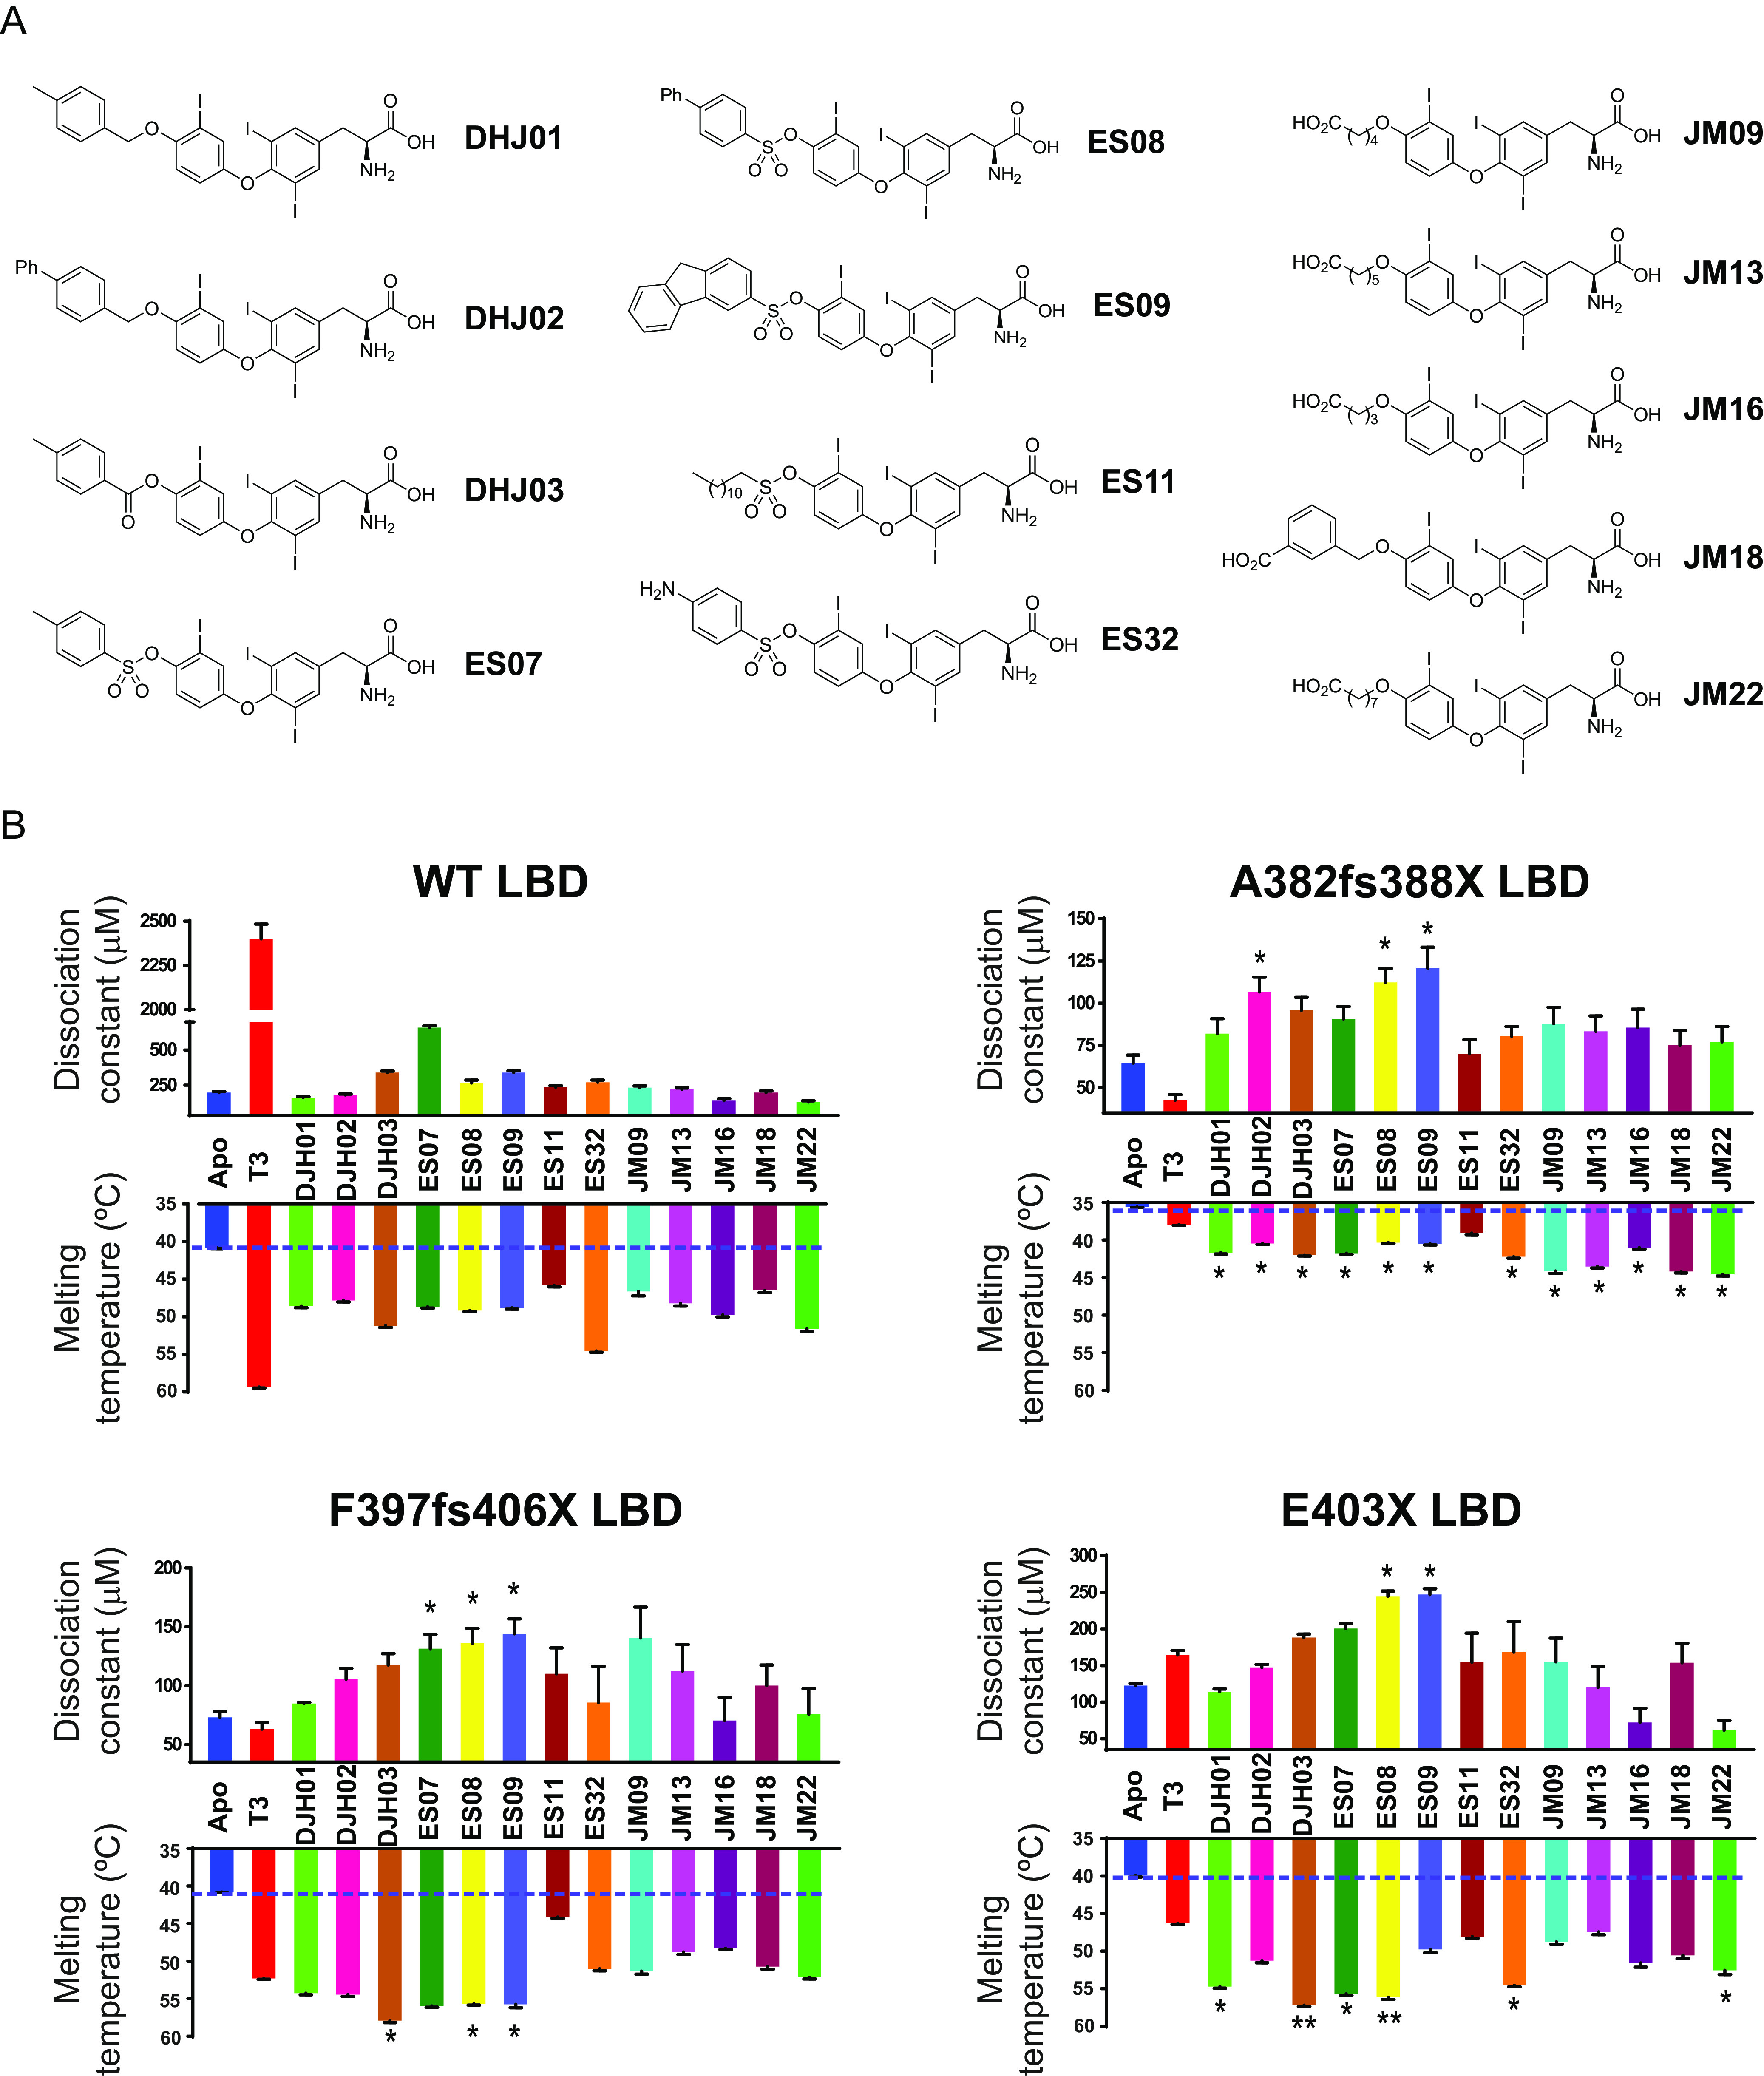
FIG 6 Effect of T3 and analogues on binding of wild-type and mutant TRα LBDs to corepressor. (A) Chemical structures of T3 analogues. Three series of novel T3 derivatives are shown. Each series contains an extension at the 4′ hydroxyl group of T3 linked with either an ether, ester, or sulfonate ester functional group. The extensions differ in size, hydrophobicity, and conformational flexibility. The JM ligands also have a carboxylic acid at the distal end of the extension. (B) Corepressor-binding affinity (dissociation constants) in fluorescence anisotropy assays (upper graphs) and thermal stability (melting temperature; bottom graphs) of wild-type and mutant TRα LBDs in the presence of T3 and different analogues. Anisotropy values were measured at each concentration of the protein:T3 analogue (molar ratio, 1:2) mixture to generate saturation-binding curves, from which the equilibrium dissociation constant of the interaction (Kd) was calculated. Error bars indicate ± SEM (n = 3); *P < 0.05 for comparisons of TRα mutants and T3 versus TH analogues. Melting temperatures of apo receptor proteins (blue) with either T3 (red) or T3 analogues (different colors), obtained by measuring changes in ellipticity of samples at 222 nm over a temperature range (20 to 90°C, 1-degree steps), are also shown. Error bars indicate mean ± SEM. (n = 3); *, P < 0.05; **, P < 0.01 for comparisons of TRα mutants and T3 versus TH analogues.