
|
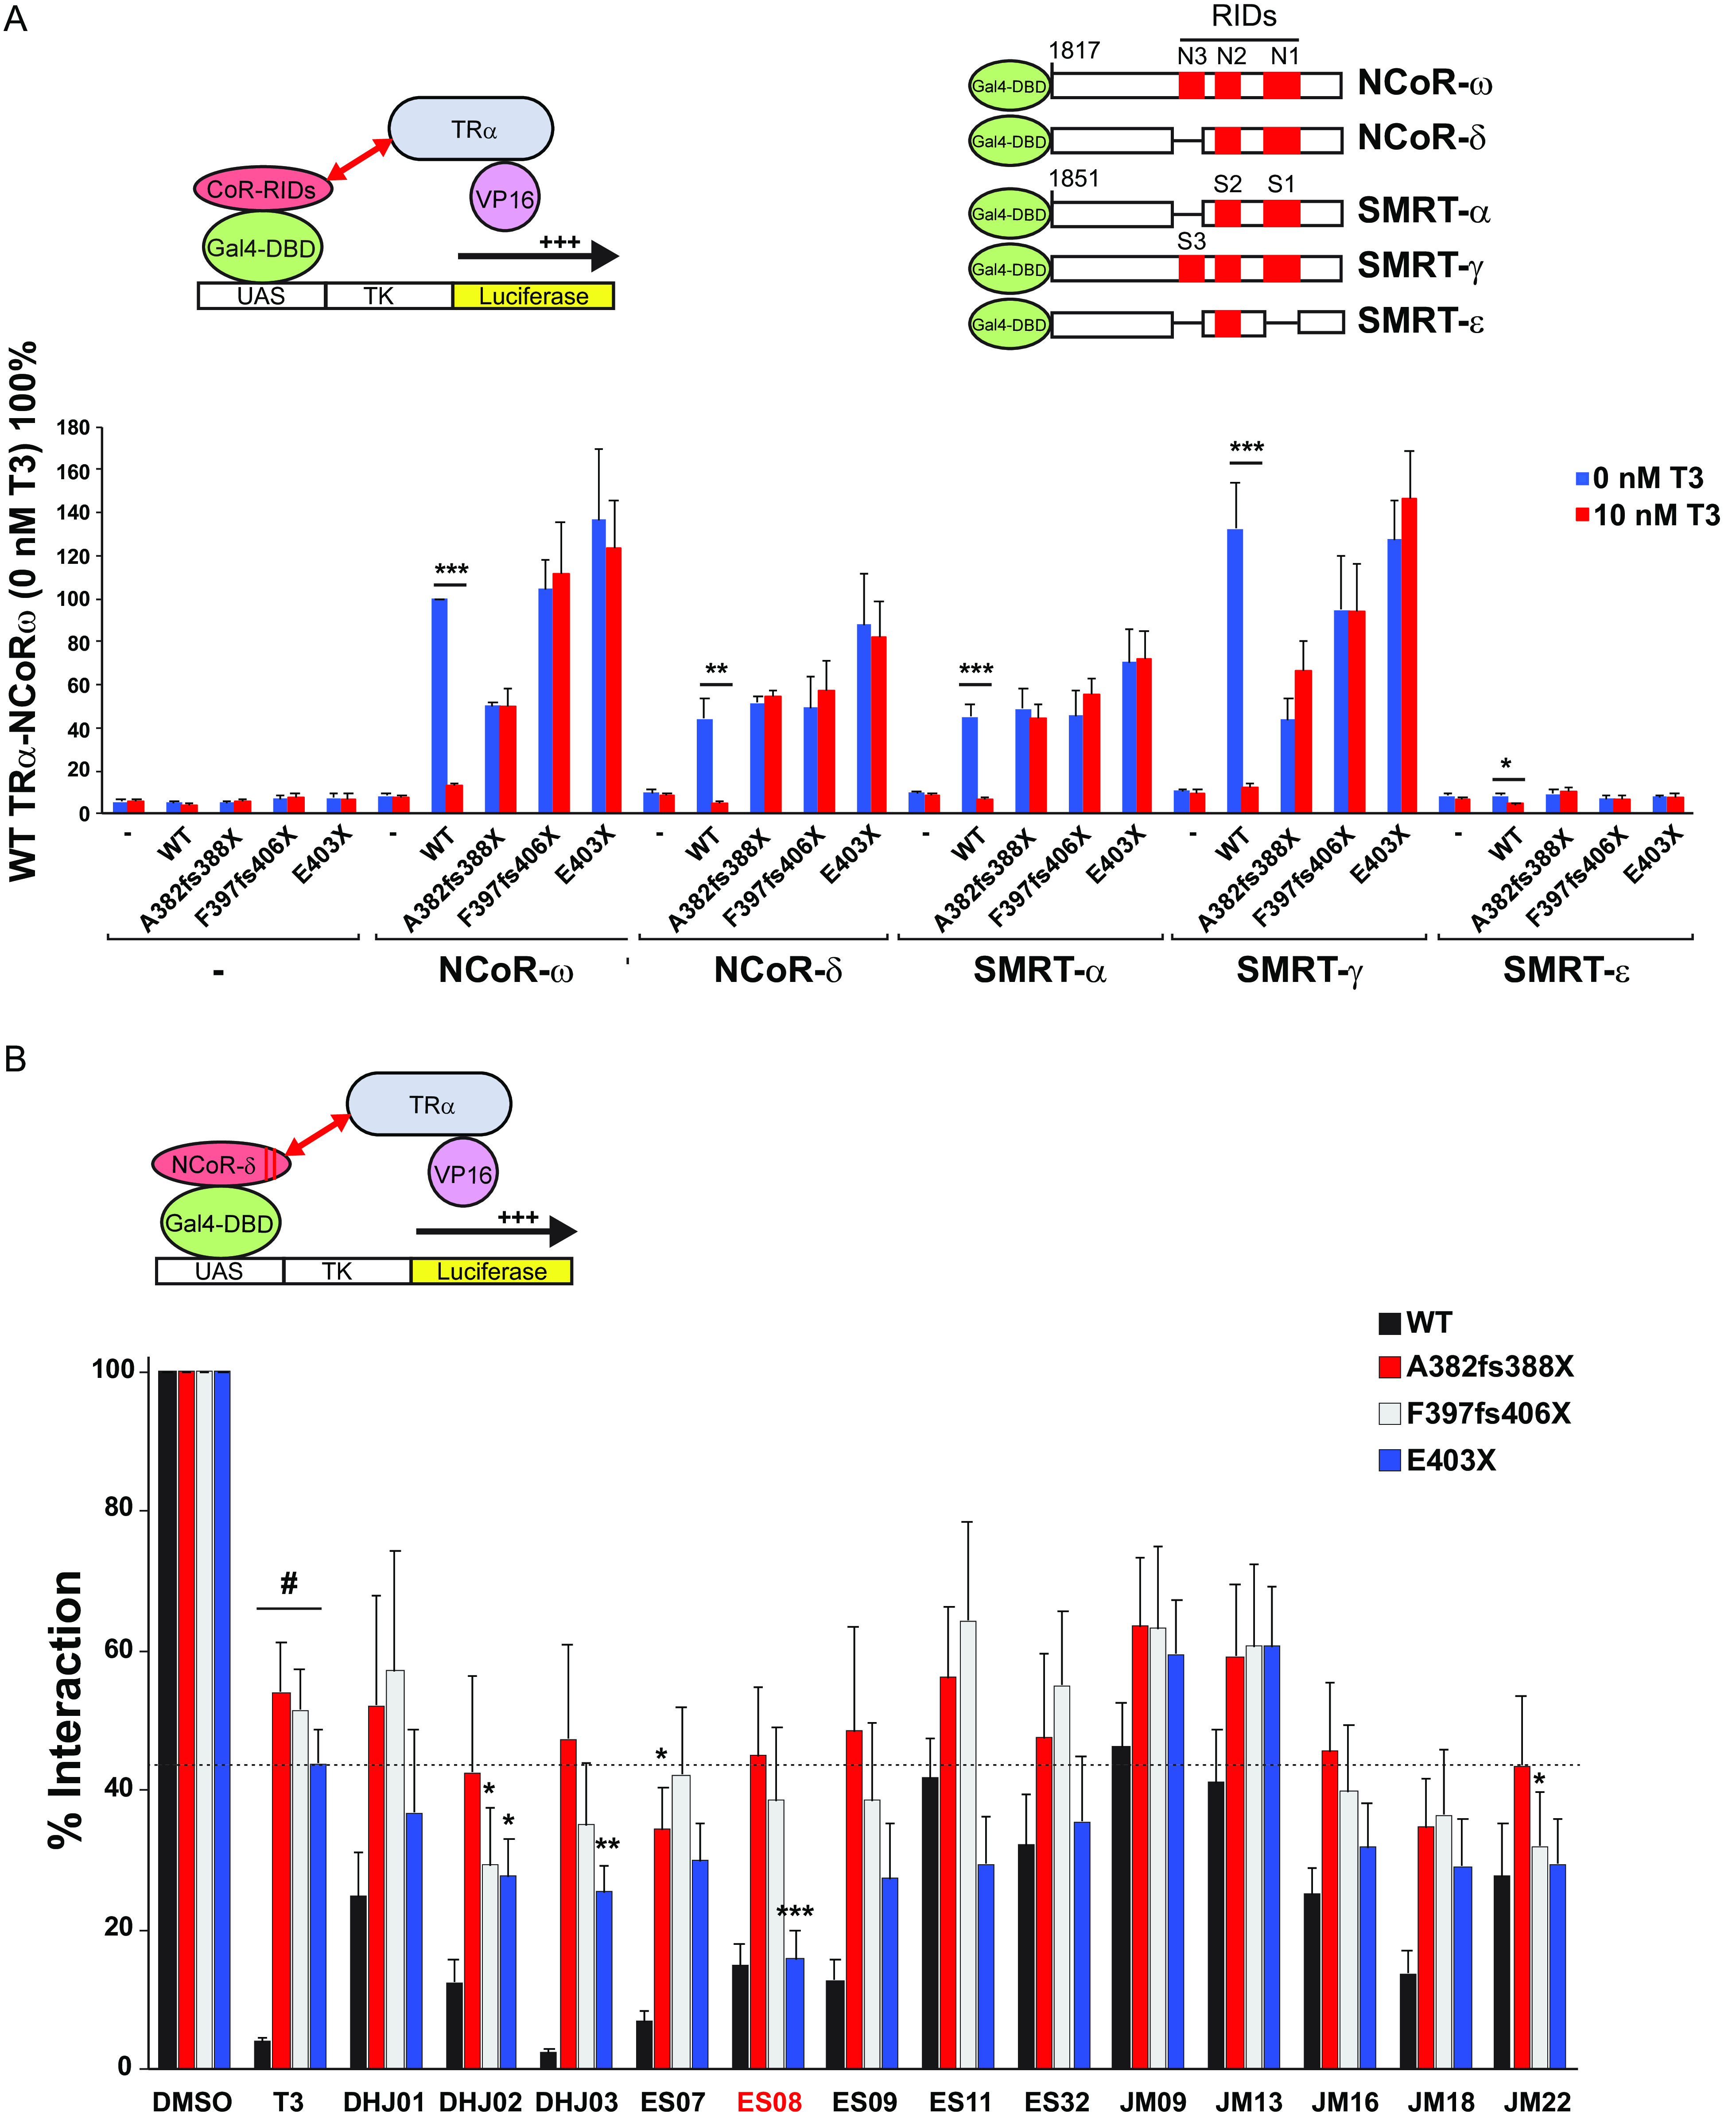
FIG 8 Interaction of VP16-TRα with GAL4-corepressor in mammalian cells. (A) Schematic representation of the cellular two-hybrid assay (left) and different human GAL4-corepressor isoforms (with locations of nuclear receptor interaction domains in red) tested (right). Below, this interaction of WT or mutant VP16-TRα fusions with different corepressor isoforms in the absence or presence of T3 is shown. Results are presented as mean ± SEM for at least 5 independent experiments performed in triplicate. *, P < 0.05; **, P < 0.01; ***, P < 0.001 for 0 nM T3 versus 10 nM T3 comparisons. (B) Interaction of GAL4-NCOR-δ with VP16-WT or mutant TRα fusions in the presence of vehicle (DMSO), 100 nM T3, or a different analogue. Results from at least 5 independent experiments are shown as percentages of interaction for WT or TRα mutants with NCoR-δ with vehicle. *, P < 0.05; **, P < 0.01; ***, P < 0.001 for comparisons of TRα mutants and T3 versus TRα mutants and analogue; #P < 0.001 for comparison of WT versus TRα mutants with 100-nM T3.