
- Title
-
Loss of Polycomb Repressive Complex 2 Function Alters Digestive Organ Homeostasis and Neuronal Differentiation in Zebrafish
- Authors
- Raby, L., Völkel, P., Hasanpour, S., Cicero, J., Toillon, R.A., Adriaenssens, E., Van Seuningen, I., Le Bourhis, X., Angrand, P.O.
- Source
- Full text @ Cells
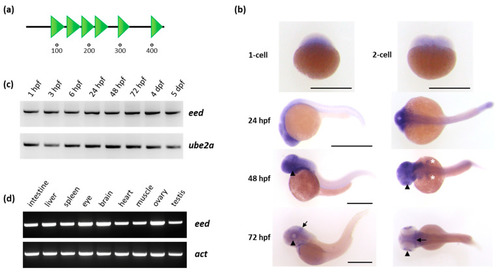
Organization of the Eed protein and eed mRNA expression in zebrafish: (a) schematic representation of the Eed protein. The zebrafish protein, as its human ortholog, is composed of 441 amino acids and contains six WD40 domains (SMART: SM000320) shown as green triangles; (b) whole-mount RNA in situ hybridization showing maternally provided eed transcripts at the 1-cell and 2-cell stage, and zygotic eed mRNA distribution at 24, 48 and 72 hpf. At these later stages, a lateral view is at the left and a dorsal view at the right. The arrowheads show the retina, the white asterisks the pectoral fin buds, and the arrow identify the midbrain-hindbrain boundary. Scale bar is 500 µm; (c) RT-PCR experiment showing the detection of eed transcripts at 1 hpf, 3 hpf, 6 hpf, 24 hpf, 48 hpf, 72 hpf, 4 dpf, and 5 dpf. Ube2a is used as a control; (d) RT-PCR experiment showing eed mRNAs in adult zebrafish tissues. Beta-actin (act) is used as a control. (See Supplementary Materials). |

Loss of eed gene function leads to zebrafish death at around 10–12 dpf: (a) schematic representation of the genomic structure of the eed gene, with coding and untranslated sequences depicted as solid and open boxes, respectively. The sequence targeted by the TALEN in exon 3 is indicated with left and right TALEN binding sites shown in red, while the BseNI restriction sequence is underlined; (b) identification of mutant embryos using restriction fragment length polymorphism. Genomic DNA was prepared from an uninjected (Control) and an eed TALEN injected (TAL-eed) embryo, amplified by PCR and subjected to BseNI digestion. The TAL-eed injected embryo contains undigested material (arrow at 407 bp), indicating that the BseNI diagnostic restriction site has been disrupted; (c) sequence of the mutant allele compared to its wild-type counterpart. Dashes show deleted nucleotides. The mutated eedul4 allele possesses a deletion of 14 nucleotides; (d) schematic representation of wild-type (Eedwt) and predicted mutant (Eedul4) proteins. The gray line in the predicted mutant protein corresponds to residues read out of frame prior to encountering a premature STOP codon. The green triangles in the wild-type protein show the WD40 domains; (e) Kaplan–Meier survival curves over 18 days for eed+/+ (red curve) and eed−/− (green curve) siblings from a cross between heterozygous eed+/− fish. The number of fish considered is indicated; (f) measurement of the total length of eed+/+ (red) and eed−/− (green) siblings from a cross between heterozygous eed+/− fish at 11 dpf. Statistical significance was assessed using a t-test; (g) measurement of the eye diameter of eed+/+ (red) and eed−/− (green) siblings from a cross between heterozygous eed+/− fish at 11 dpf. Statistical significance was assessed using a Student t-test. PHENOTYPE:
|
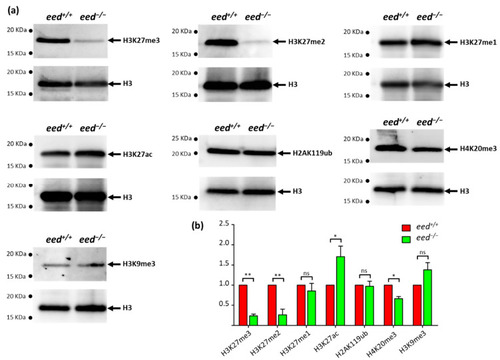
Effects of eed loss of function on global levels of histone modifications: (a) after genotyping of the caudal extremity of larvae, 10 to 15 µg of bulk histones from a pool of 10 eed+/+ or eed−/− siblings at 9 dpf were analyzed by Western blot using specific antibodies recognizing H3K27me3, H3K27me2, H3K27me1, H2AK119ub, H3K27ac, H3K9me3 or H4K20me3. After stripping, the membranes were reprobed with an anti-histone H3 as a control; (b) comparison between eed+/+ (red) and eed−/− (green) siblings, of histone modification signals normalized by total histone H3 and expressed relative to the levels found in the wild-type fish. Quantified levels are the mean ± SD of at least three independent histone extractions, except for H3K9me3, where two histone extraction were performed, followed by Western blot analysis. Statistical significance was assessed using a Student t-test; ns, non-significant; *, p < 0.05; **, p < 0.01. (See Supplementary Materials). |
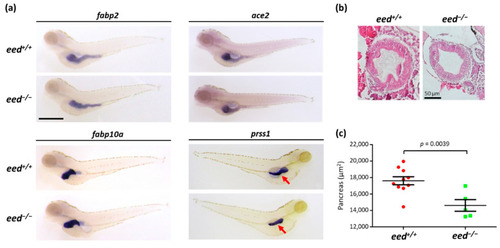
Organization of the digestive organs at 5 dpf: (a) whole-mount RNA in situ hybridization to detect the expression of markers of the intestine (fabp2, ace2), the liver (fapb10a), and the exocrine pancreas (prss1) in eed+/+ and eed−/− siblings at 5 dpf. The red arrow shows the pancreas. Scale bar is 500 µm; (b) intestinal bulb sections from eed+/+ (left) and eed−/− (right) larvae at 5 dpf stained with hematoxylin and eosin. Scale bar is 50 µm; (c) measurement of the surface of the pancreas labeled by in situ hybridization using a prss1 probe at 5 dpf for eed+/+ (red) and eed−/− (green) larvae. Statistical significance was assessed by a Student t-test, and the corresponding p-value is indicated. |
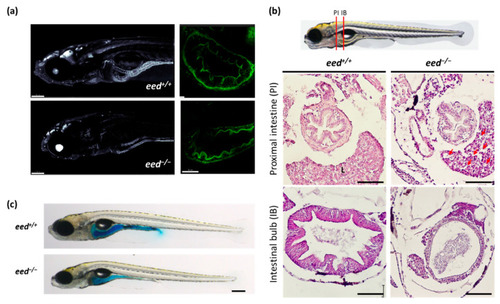
Structure of the intestine at 9–11 dpf: (a). confocal imaging of the anterior part (left, scale bar is 150 µm) and of the intestine bulb (right, scale bar is 50 µm) of transgenic Tg (actb2:GFP-Hsa.UTRN)e116 zebrafish larvae, wild-type (up) or lacking eed function (down) at 9 dpf; (b) histological sections stained with hematoxylin and eosin at the levels of the proximal intestine (PI) and the intestinal bulb (IB) as indicated from eed+/+ (left) and eed−/− (right) siblings at 11 dpf. Red arrows show macrovesicles. L, liver. Scale bar is 50 µm; (c) Smurf assay performed on eed+/+ and eed−/− siblings at 11 dpf. Scale bar is 200 µm. |

Liver alterations in eed-deficient larvae: (a) representative images of lateral views of eed+/+ and eed−/− larvae stained with oil red-O at 11 dpf. The red arrow shows the liver. Scale bar is 500 µm; (b) histological sections stained with hematoxylin and eosin showing the liver of eed+/+ and eed−/− larvae at 11 dpf. Red arrows show macrovesicles. Scale bar is 50 µm; (c) quantification of macrovesicular steatosis eed+/+ (red) and eed−/− (green) larvae at 11 dpf. The ratio of macrovesicular structures relative to total hepatic surface was calculated on 3 histological slices per larvae from 4 different larvae per genotype. Statistical significance was assessed using a Mann–Whitney t-test; (d) relative levels of fasn, srebf1, pparg, and nr1h3 RNA abundances in 9 dpf old eed+/+ (red) and eed−/− (green) larvae quantified by RT-qPCR. Three independent experiments were performed, and error bars represent standard deviation. Statistical analysis was performed using a one-way ANOVA test followed by a Dunn’s multiple test comparison; ns, non-significant; *, p < 0.05; **, p < 0.01. |
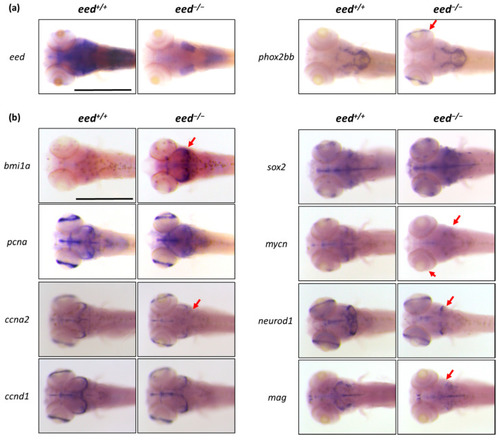
Whole-mount RNA in situ hybridization of the brain region of eed+/+ and eed−/− siblings at 5 dpf: (a) whole-mount in situ hybridization to detect eed (left) and phox2bb RNA expression. The red arrow shows the phox2bb ectopic expression in the retina of eed mutants. Scale bar is 500 µm; (b) whole-mount in situ hybridization to detect the expression profiles of stemness (bmi1a, sox2), proliferation (pcna, mycn), cell cycle (ccna2, ccnd1), and neuronal/glial precursor (neurod1, mag) markers. The red arrows emphasize expression profile differences between eed+/+ and eed−/− larvae. Scale bar is 500 µm. |
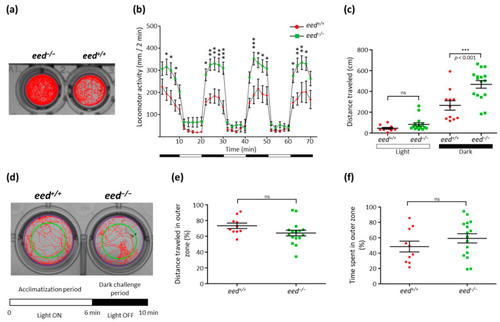
Behavioral comparison between wild-type and eed−/− mutants at 5 dpf: (a) locomotor tracking for a 70 min recording of an eed−/− mutant (left) and a wild-type (right) larvae; (b) distance traveled throughout a 70 min session for wild-type (red, n = 11) and eed−/− mutant (green, n = 16). Data are presented as mean ± SD of the distance moved (in mm) in 2 min intervals. Black and white bars at the bottom indicate dark and light conditions, respectively. Statistical analysis was performed using two-way ANOVA followed by Bonferroni posttest comparisons; ns, non-significant; *, p < 0.05; **, p < 0.01; ***, p < 0.001; (c) cumulative distance traveled for each wild-type (red) and mutant (green) larvae during the light (left) and dark (right) periods. Statistical analysis was performed using one-way ANOVA followed by Bonferroni posttest comparisons; ns, non-significant; ***, p < 0.001; (d) the experimental procedure for the thigmotaxis assay is composed of a 6 min acclimatization period with the light ON followed by a 4 min visual motor challenge period with the lights OFF. Experiments are performed in a 24-well plate format. Inner and outer zones are delineated by the green circle in a way that the two zones cover equivalent spatial areas. The distance traveled during the dark challenge period is shown for two larvae; (e) cumulative distance traveled in the outer zone of wild-type (red, n = 10) and eed−/− mutant (green, n = 16) larvae. Each point represents individual larvae. No statistical (ns) difference was found between wild-type and eed−/− mutants; (f) cumulative time spent in the outer zone of wild-type (red, n = 10) and eed−/− mutant (green, n = 16) larvae. Each point represents unique larvae. No statistical (ns) difference was found between wild-type and eed−/− mutants. PHENOTYPE:
|