FIGURE SUMMARY
Title

Neu1 deficiency induces abnormal emotional behavior in zebrafish

Authors
Ikeda, A., Komamizu, M., Hayashi, A., Yamasaki, C., Okada, K., Kawabe, M., Komatsu, M., Shiozaki, K.
Source
Full text @ Sci. Rep.

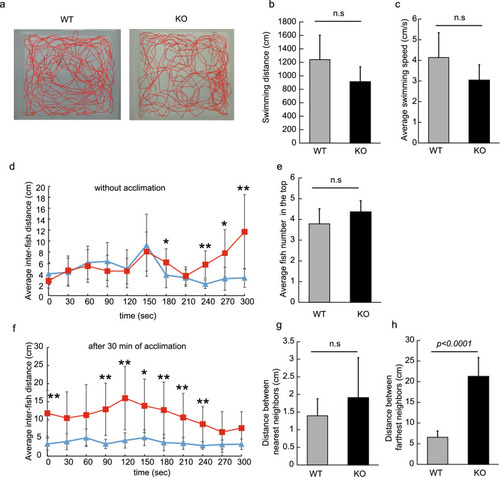
Analysis of shoaling in Neu1-KO and WT zebrafish. (ac) Analysis of the behavior of Neu1-KO zebrafish (6 months) in the normal tank for 5 min. (a) Tracking. (b) Swimming distance. (c) Average swimming speed. WT, wild-type and KO, Neu1-KO zebrafish. n = 7 for each group. (dh) Shoaling of Neu1-KO zebrafish. Five fish were set in the experimental tank, and their average inter-fish distance was immediately estimated (d, without acclimation) . After 30 min acclimation in the test tank, inter-fish distances were evaluated again (f, with acclimation). Closed blue triangles and red squares with single line indicate WT and KO, respectively. (e) Average fish number in the top area for 5 min. (g) Average distance between nearest and (h) farthest neighbors analyzed for 5 min in WT and Neu1-KO zebrafish during the shoaling test without acclimation. Results are shown as means ± standard deviation. All values were compared using Mann–Whitney U test. *p < 0.05, **p < 0.01. n.s., not significant.

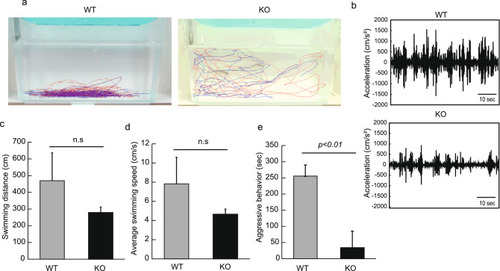
Analysis of aggressive behavior in Neu1-KO and WT zebrafish. Two unfamiliar male zebrafish were set in the transparent aquarium and their aggressive behavior was observed for 10 min. (a) Tracking of 2 males in WT and Neu1-KO. Red and blue lines indicate the swimming tracking of 2 males. (b) Swimming acceleration. (c) Swimming distance. (d) Swimming speed. (e) Aggressive behavior. n = 6 for each group. Results are shown as means ± standard deviation. All values were compared using Mann–Whitney U test. n.s., not significant.

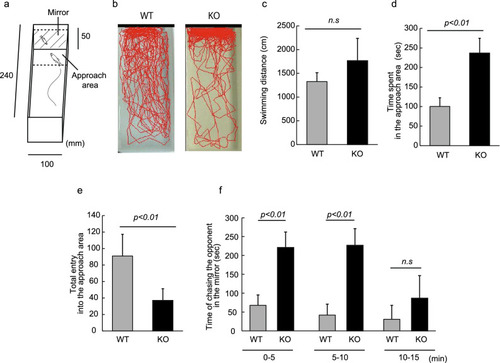
Analysis of Neu1-KO and WT zebrafish behavior in a mirror test. (a) Apparatus used in the mirror test. (b) Tracking of WT and Neu1-KO zebrafish. (c) Swimming distance. (d) Time spent in the approach area. (e) Frequency of entry into the approach area. (f) Time of chasing the opponent in the mirror. n = 10 for each group. Results are shown as means ± standard deviations. All values were compared using Mann–Whitney U test. n.s., not significant.

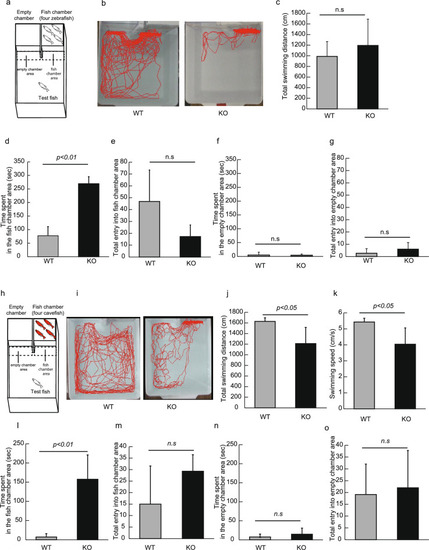
Analysis of social preference in Neu1-KO and WT zebrafish using the 3-chambers test. (ag) Analysis of the 3-chambers test with 4 unfamiliar zebrafish in Neu1-KO and WT zebrafish. (a) Apparatus of the 3-chambers test using 4 zebrafish. (b) Tracking of WT and Neu1-KO zebrafish. (c) Total swimming distance. (d) Time spent in the fish chamber area. (e) Total entry into the fish chamber area. (f) Time spent in the empty chamber area. (g) Total entry into the empty chamber area. n = 8 for each group. (ho) Analysis of the 3-chambers test with 4 cavefish in Neu1-KO and WT zebrafish. (h) Apparatus of the 3-chambers test with 4 cavefish. (i) Tracking of WT and Neu1-KO zebrafish. (j) Total swimming distance. (k) Swimming speed. (l) Time spent in the fish chamber area. (m) Total entry into fish chamber area. (n) Time spent in the empty chamber area. (o) Total entry into empty chamber area. n = 10 for each group. Results are shown as means ± standard deviation. All values were compared using Mann–Whitney U test. n.s., not significant.

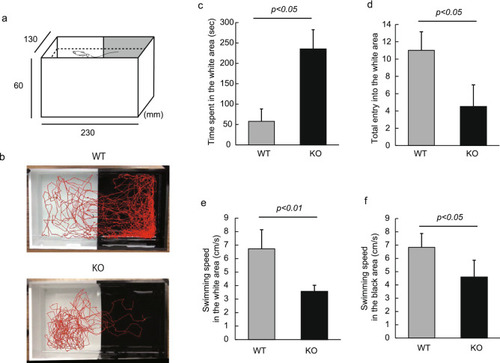
Analysis of the black–white preference test in Neu1-KO and WT zebrafish. (a) Apparatus in the black–white preference test. (b) Tracking of WT (upper panel) and Neu1-KO zebrafish behavior (lower panel). (c) Time spent in the white area. (d) Total entry into the white area. (e,f) Swimming speed in white (e) and black area (f). n = 5 for each group. Results are shown as means ± standard deviation. All values were compared using Mann–Whitney U test.

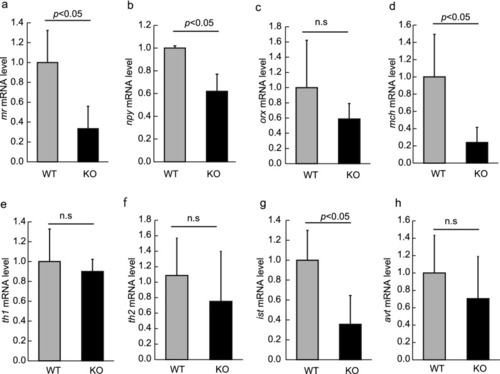
Changes in gene expression in Neu1-KO zebrafish. mRNA levels of mr (a), npy (b), orx (c), mch (d), th1 (e), th2 (f), ist (g), and avt (h) in WT and Neu1-KO zebrafish. Each level of gene expression in Neu1-KO zebrafish is relative to the value in WT fish. n = 5 for each group. Results are shown as means ± standard deviation. All values were compared using Mann–Whitney U test. n.s., not significant.

Alteration of glycoconjugates patterns in Neu1-KO zebrafish. (ac) Lysates of zebrafish brains were applied for lectin and western blotting. (a) MAM lectin. (b) SSA lectin. (c) Anti-PSA immunoblotting. Ma, Molecular marker. (d,e) GSLs were extracted from zebrafish brains and fractionated into neutral and acid fractions. Two fractions were applied for thin layer chromatography and GSLs were detected using orcinol-H2SO4. Neutral (d) and acid fraction (e) of GSLs. Results are shown as means ± standard deviation. All values were compared using Mann–Whitney U test.

PHENOTYPE:
Fish:
Observed In:
Stage: Adult

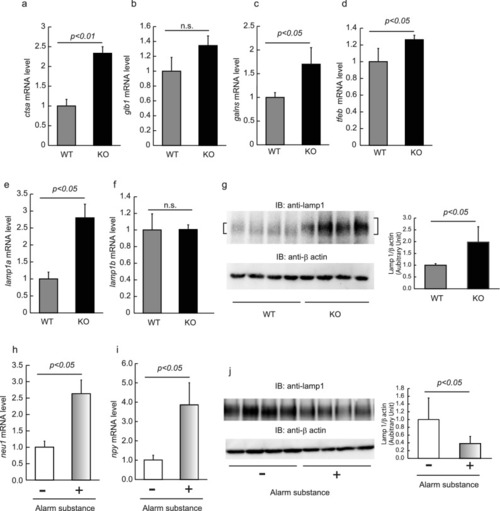
Changes in the expression of lysosomal genes in Neu1-KO zebrafish. mRNA levels of ctsa (a), glb1 (b), galns (c), tfeb (d), lamp1a (e), and lamp1b (f) in WT and Neu1-KO zebrafish. Each level of gene expression in Neu1-KO zebrafish is relative to the value in WT fish. n = 7 for each group. (g) Lysates of zebrafish brains were applied for western blotting using anti-lamp1 and anti-β actin antibodies. Quantitative analyses of the intensities of Lamp1 and β-actin bands were carried out and results are presented as Lamp1/β-actin. (hj) WT zebrafish were exposed to alarm substances and then the neu1 (h) and npy mRNA levels (i) were estimated by real-time PCR. Lysates of zebrafish brains were applied for western blotting using anti-lamp1 and anti-β actin antibodies (j). Quantitative analyses of the intensities of Lamp1 and β-actin bands were carried out and results are presented as Lamp1/β-actin. n = 6 for each group. Results are shown as means ± standard deviation. All values were compared using Mann–Whitney U test. n.s., not significant.

Acknowledgments
This image is the copyrighted work of the attributed author or publisher, and ZFIN has permission only to display this image to its users. Additional permissions should be obtained from the applicable author or publisher of the image. Full text @ Sci. Rep.