
IMAGE
Figure 6
- ID
- ZDB-IMAGE-210708-17
- Genes
- Publication
- Ikeda et al., 2021 - Neu1 deficiency induces abnormal emotional behavior in zebrafish
- All Figures
- Figures for Ikeda et al., 2021
Image
|
Figure Caption
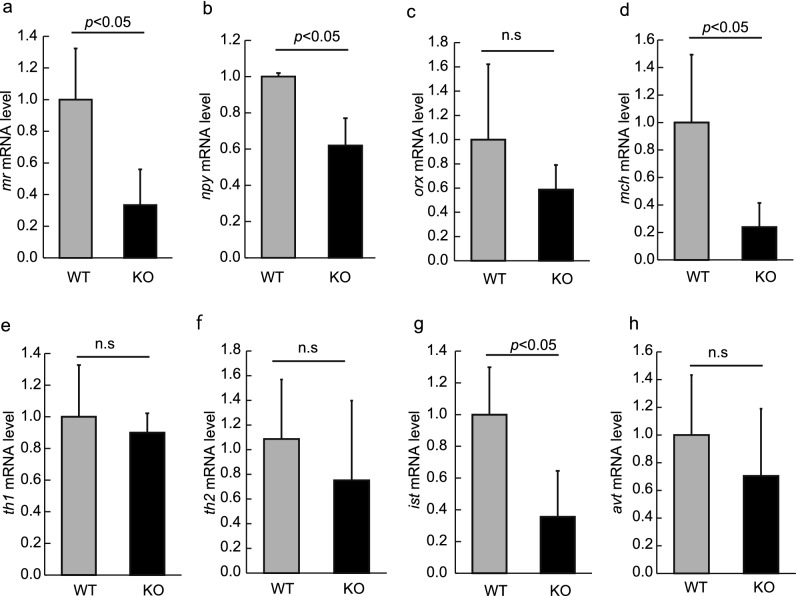
Figure 6
Changes in gene expression in Neu1-KO zebrafish. mRNA levels of
Figure Data
Acknowledgments
This image is the copyrighted work of the attributed author or publisher, and
ZFIN has permission only to display this image to its users.
Additional permissions should be obtained from the applicable author or publisher of the image.
Full text @ Sci. Rep.