- Title
-
Interleukin 10 mutant zebrafish have an enhanced interferon gamma response and improved survival against a Mycobacterium marinum infection
- Authors
- Harjula, S.E., Ojanen, M.J.T., Taavitsainen, S., Nykter, M., Rämet, M.
- Source
- Full text @ Sci. Rep.
|
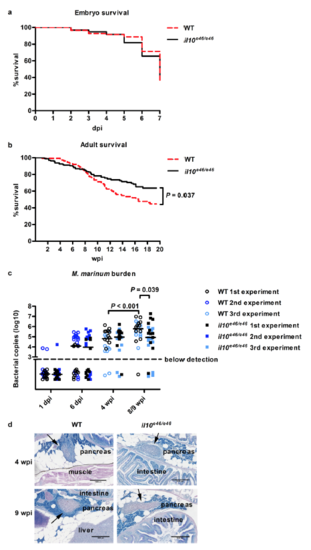
Adult il10e46/e46 zebrafish have enhanced survival compared to WT controls in a low-dose M. marinum infection. (a) il10e46/e46 (n = 158) and WT (n = 181) zebrafish larvae were microinjected before 6 hours post fertilization with M. marinum (3–29 CFU) and their survival was monitored for 7 days. The experiment was done six times and the data presented here is collected from one representative experiment. (b) The survival of adult il10e46/e46 (n = 172) and WT (n = 149) zebrafish was monitored for 16–20 weeks after a low-dose (2–156 CFU) mycobacterial infection. The data were collected from four experiments. (c) The M. marinum burden in abdominal organ blocks (including kidney in the first and the second experiment, without kidney in the third experiment) of adult il10e46/e46 mutant zebrafish (n = 22–27) and WT controls (n = 22–30 fish) was quantified with qPCR at 4 and 8/9 weeks post a low-dose infection (1–18 CFU). The bacterial load is presented as a scatter dot plot and as the median of total bacterial copies (log10). The data were collected from three experiments. (d) M. marinum granulomas were detected with Ziehl-Neelsen staining (n = 4 in both groups at both time points) at 4 and 9 weeks post a low-dose infection (2–9 CFU). Representative individuals from each group are shown. Granulomas are indicated with arrows. For panels (a) and (b) a log-rank (Mantel-Cox) and for panel (c) A two-tailed Mann-Whitney test was used for the statistical comparison of differences. |
|
Unchallenged il10e46/e46 zebrafish have similar expression profiles of lymphocyte markers and cytokines as WT control fish in the intestine. (a) The relative expression of il10, selected proinflammatory cytokines (il1b, tnfa, tnfb), Th cell cytokines (ifng1 and il4), T cell markers (cd4-1 and cd8a), a B cell marker (IgM) as well as Cd4+ lymphocyte transcription factors (tbx21, gata3, foxp3a) in il10e46/e46 mutant zebrafish (n = 9) and WT controls (n = 13) in intestine were quantified with qPCR and are represented as scatter dot plot and median. Note the different scales of the y axes and the divided y axis. Gene expressions were normalized to the expression of eef1a1l1. A two-tailed Mann-Whitney test was used for the statistical comparison of differences between il10e46/e46 zebrafish and WT controls. (b) The visual appearance of il10e46/e46 mutant and WT control zebrafish intestine was studied by microscopy (n = 3 in both groups). A representative image from each group is shown. |

Unillustrated author statements |


