- Title
-
Targeted knockout of a chemokine-like gene increases anxiety and fear responses
- Authors
- Choi, J.H., Jeong, Y.M., Kim, S., Lee, B., Ariyasiri, K., Kim, H.T., Jung, S.H., Hwang, K.S., Choi, T.I., Park, C.O., Huh, W.K., Carl, M., Rosenfeld, J.A., Raskin, S., Ma, A., Gecz, J., Kim, H.G., Kim, J.S., Shin, H.C., Park, D.S., Gerlai, R., Jamieson, B.B., Kim, J.S., Iremonger, K.J., Lee, S.H., Shin, H.S., Kim, C.H.
- Source
- Full text @ Proc. Natl. Acad. Sci. USA
|
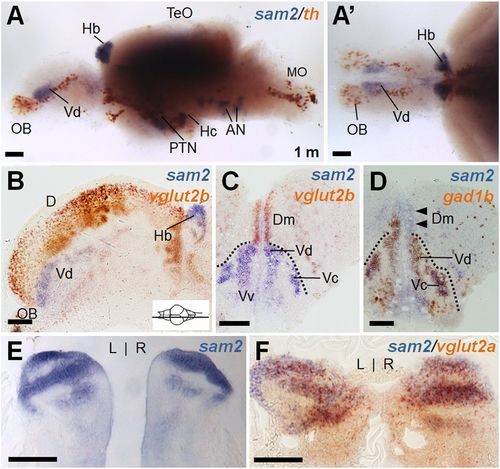
Characterization of sam2-expressing cells in the adult zebrafish brain. (A and A′) Whole-mount two color in situ hybridization of a dissected zebrafish brain with sam2 and a dopaminergic neuron marker, th. Anterior is to the left; lateral (A) and dorsal view (A′). The sam2 expression region did not overlap with th+ neurons. Prominent sam2 expression is seen in the Vd and Hb as well as hypothalamic regions. (B–D) Section images of brain hybridized with sam2/vglut2b (B, sagittal section; C, cross-section) or sam2/gad1b (D). (E and F) Cross-section of Hb region stained with sam2 alone (E) or sam2/vglut2a (F) probes. AN, auditory nerve; D, area dorsalis telencephlali; Dc, central zone of area dorsalis telencephali; MO, medulla oblongata; OB, olfactory bulb; TeO, optic tectum; Vv, ventral nucleus of area ventral telencephali. (Scale bars, 100 µm.) EXPRESSION / LABELING:
|
|
Generation of sam2 KO fish using ZFNs. (A) DNA sequencing analysis of two sam2 KO alleles (sam2cnu1 and sam2cnu2) with 5-bp and 17-bp deletion, respectively. Yellow mark, Left and Right ZFN-binding regions; red, spacer. (B and B′) Allele-specific genotyping of sam2cnu1 and sam2cnu2 KO fish by genomic PCR and digestion for BtgI site (CCGTGG) newly created in sam2cnu1. (C and C′) Normal morphology of sam2cnu1 KO embryo at 3 d. (D–E′) Projections of Hb efferent axons targeting the IPN in the Et(-1.0otpa:mmGFP)hd1 transgenic sam2cnu1 KO fish were not visibly affected. Lateral views (D and E) and dorsal views (D′ and E′). dIPN, dorsal IPN; FR, fasciculus retroflexus; lFR, Left FR; lHb, Left Hb; MR, median raphe; rFR, Right FR; rHb, Right HbvIPN, ventral IPN. (Scale bar, 100 µm.) EXPRESSION / LABELING:
PHENOTYPE:
|

ZFIN is incorporating published figure images and captions as part of an ongoing project. Figures from some publications have not yet been curated, or are not available for display because of copyright restrictions. PHENOTYPE:
|
|
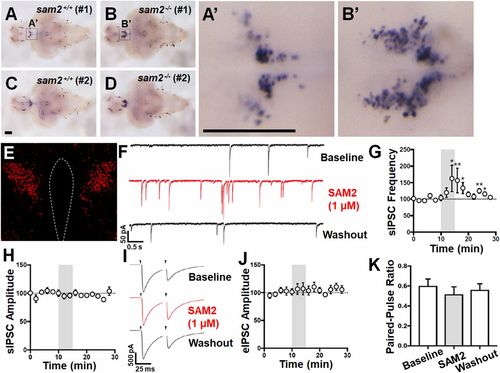
Increase of mRNA expression of stress-related crhb in sam2cnu1 KO fish and spontaneous inhibitory postsynaptic currents onto CRH neurons by SAM2. (A–D) Increase of crhb mRNA expression in sam2cnu1 KO fish (sam2+/+, n = 6; sam2−/−, n = 6). Ventral views of the whole brain of control sam2+/+ (A and C) and sam2−/− KO fish (B and D). (A′ and B′) Higher magnifications of the boxed regions in A and B are the PPa in zebrafish, homologous to the mouse PVN. (Scale bars, 200 µm.) (E) Representative photomicrograph of the Cre-dependent TdTomato in the PVN CRH neurons. (Magnification: E, 10×.) (F) Representative voltage-clamp traces of sIPSCs in response to SAM2 application in PVN CRH neurons. (G) SAM2 application significantly increased sIPSC frequency. (H) SAM2 did not affect sIPSC amplitude. (I) Representative voltage-clamp trace of eIPSC onto CRH neurons in response to SAM2 application. (J) SAM2 did not affect the amplitude of eIPSCs. (K) SAM2 did not change the paired-pulse ratio. *P < 0.05; **P < 0.01. EXPRESSION / LABELING:
PHENOTYPE:
|
|
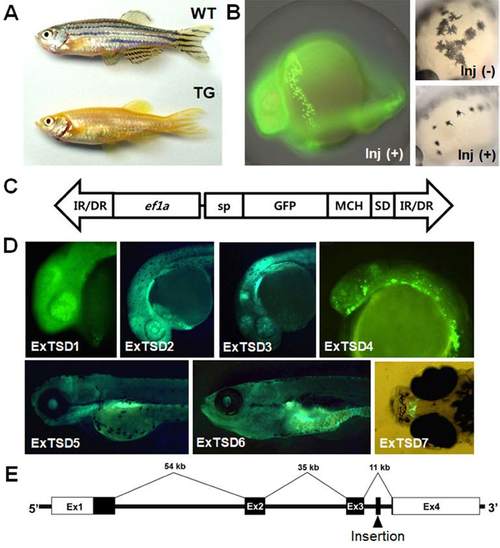
Dual reporter system used for insertional mutagenesis, the golden fish project. (A) Body color change in MCH-expressing transgenic zebrafish (TG, a cmv:mch tg line), compared to wild-type adult fish (WT). (B) Expression of dual reporter, GFP-MCH fusion protein, in ef1a:gfp-mch-injected zebrafish embryos. GFP fluorescence and melanosome aggregation are detectable in injected embryos, inj (+), compared to un-injected control embryo, inj (-). (C) Structure of a gene trap vector used in insertional mutagenesis. IR/DR; inverted repeat/direct repeat element; ef1a, elongation factor 1 alpha (ef1a) gene promoter; sp, signal peptide; GFP; green fluorescent protein; MCH, melanin-concentrating hormone; SD, splice donor. (D) Representative mutants showing GFP expression in various tissues (ExTSD1-7; images not to scale). (E) Mapping of the insertion site (arrow) in the intron 3 of a samdori gene on chromosome 4. |
|
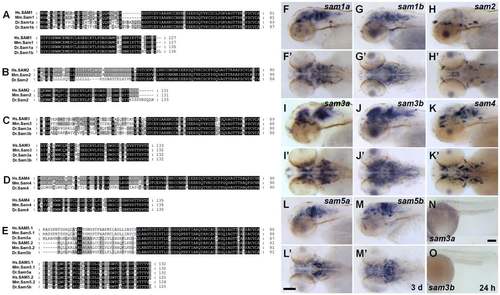
Conserved synteny and CNS-specific expression of samdori gene family. (A) Alignments of zebrafish sam1a and sam1b amino acids with that of human SAM1 and mouse Sam1 (Genbank accession for human and mouse, NM_213609; NM_182808, respectively). (B) Alignments of zebrafish sam2 amino acids with human SAM2 and mouse Sam2 (NM_178539; NM_182807). (C) Alignments of zebrafish sam3a and sam3b amino acids with human SAM3 and mouse Sam3 (NM_182759; NM_183224). (D) Alignments of zebrafish sam4 amino acid with human SAM4 and mouse Sam4 (NM_001005527; NM_177233). (E) Alignments of zebrafish sam5a and sam5b amino acids with human SAM5.1, SAM5.2 and mouse Sam5.1, Sam5.2 (NM_001082967; NM_015381; NM_001252310; NM_134096). (F-O) Whole-mount in situ hybridization was performed to detect the expression of mRNAs. All sam gene family members are exclusively expressed in the brain. Three day-old (3d) embryos (F-M’). sam3a and sam3b showed additional expression in the spinal cord at 24 h, lateral views (N, O). Lateral views (F-M). Dorsal views (F’-M’). Scale bar, 100 μm. EXPRESSION / LABELING:
|
|
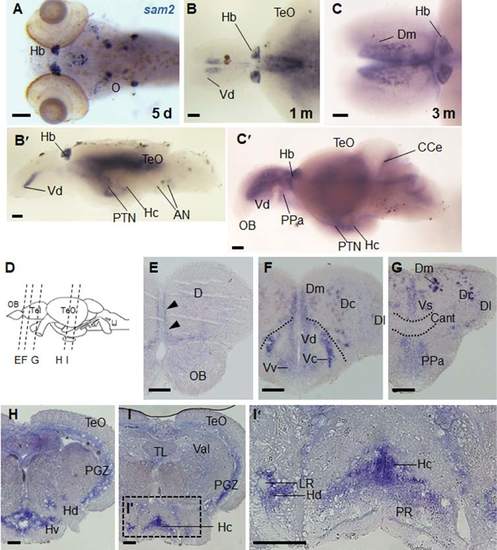
Expression of sam2 in the larval and adult brain. Whole-mount in situ hybridization of sam2 in larva and adult (1- and 3-month; 1 m, 3 m) (A) sam2-expressing cells in 5 day-old larvae. Habenula (Hb) expression is already prominent at this stage. Expression in the otic neurons (O) is also seen. (B, B’) At 1-month, expression of sam2 in the brain. Dorsal telencephalic view (B) and lateral view (B’). (C, C’) sam2 expression in the adult brain. Dorsal telencephalic view (C) and lateral view (C’). (E-I’) Serial sections of adult brain. Levels of the cross-sections are indicated in (D). Scale bar, 100 μm. AN, auditory nerve; Cant, anterior commissure; CCe, corpus cerebelli; D, area dorsalis telencephlali; Dc, central zone of area dorsalis telencephali; Dl, lateral zone of area dorsalis telencephali; Dm, medial zone of area dorsalis telencephali; Hc, caudal zone of periventricular hypothalamus; Hd, dorsal zone of periventricular hypothalamus; Hv, ventral zone of periventricular hypothalamus; LR, lateral recess of diencephalic ventricle; OB, olfactory bulb; PGZ, periventricular gray zone; PPa, parvocelluar preoptic nucleus, anterior part; PR, posterior recess; PTN, posterior tuberal nucleus; TeO, optic tectum; TL, torus longitudinalis; Val, lateral division of vlvula cerebelli; Vc, central nucleus of area ventral telencephali; Vd, dorsal nucleus of area ventral telencephali; Vs, supracommissural nucleus of area ventral telencephali; Vv, ventral nucleus of area ventral telencephali. |
|
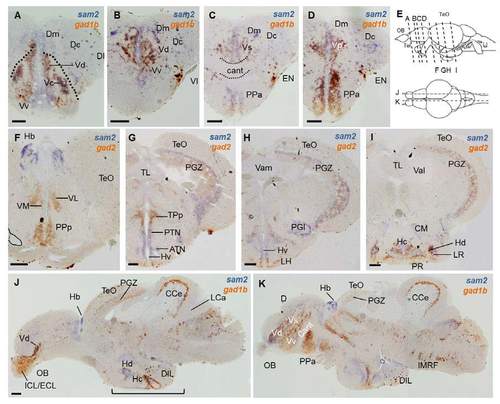
Two color in situ hybridization of sam2 with gad1b or gad2 in adult brain. (A-D) Cross section of telencehpalic region. (F-I) Cross section of diencephalic area. (J, K) Sagittal section of whole brain. Expression region of sam2 is partially overlapped by that of gad1b in several brain regions, including telencephalon and hypothalamus. Levels of the sections (top, cross section; bottom, sagittal section) are indicated in (E). Scale bar, 100 μm. ATN, anterior tuberal nucleus; Cant, anterior commissure; CCe, corpus cerebelli; CM, corpus mamillare; D, area dorsalis telencephlali; Dc, central zone of area dorsalis telencephali; DIL, diffuse nucleus of the inferior lobe; Dl, lateral zone of area dorsalis telencephali; Dm, medial zone of area dorsalis telencephali; ECL, external cellular layer of olfactory bulb; EN, entopedunclular nucleus; Hc, caudal zone of periventricular hypothalamus; Hd, dorsal zone of periventricular hypothalamus; Hv, ventral zone of periventricular hypothalamus; ICL, internal cellular layer of olfactory bulb; IMRF, intermediate reticular formation; LCa, caudal lobe of the cerebellum; LH, lateral hypothalamic nucleus; LR, lateral recess of diencephalic ventricle; OB, olfactory bulb; PGl, lateral preglomerular nucleus; PGZ, periventricular gray zone; PPa, parvocelluar preoptic nucleus, anterior part; PPp, parvocellular preoptic nucleus, posterior part; PR, posterior recess; PTN, posterior tuberal nucleus; TL, torus longitudinalis; TPp, periventricular nucleus of posterior tuberculum; Val, lateral division of vlvula cerebelli; Vam, medial division of valvula cerebelli; Vc, central nucleus of area ventral telencephali; Vd, dorsal nucleus of area ventral telencephali; VL, ventrolateral thalamic nucleus; VM, ventromedial thalamic nucleus; Vp, Ventral pallium; Vs, supracommissural nucleus of area ventral telencephali; Vv, ventral nucleus of area ventral telencephali. |
|
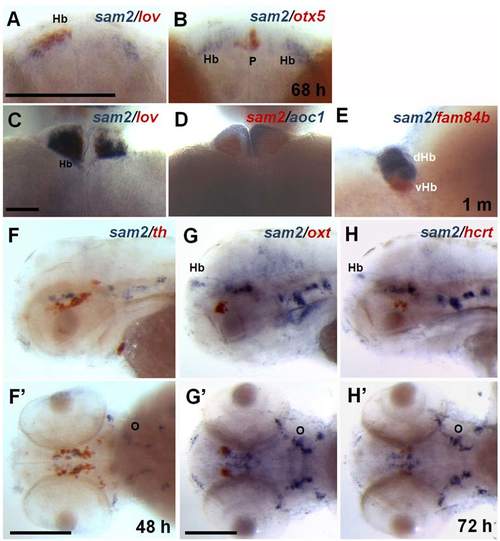
Characterization of sam2-expressing cell populations in larval zebrafish. Two-color whole-mount in situ hybridization was performed to identify sam2-positive cells, comparing with known habenula (Hb) markers: lov (kctd12.1), dorsal Hb (dHb); aoc1, ventral Hb (vHb); fam84b, both dHb and vHb marker; otx5, pineal organ (p) marker. (A, B) 68 hour-old larvae. Dorsal view. (C-E) Adult brain. Dorsal view, except for lateral view in (E). Note the specific expression of sam2 in the dorsal Hb. Other than Hb, sam2-expressing cells do not overlap with markers of dopaminergic neurons (th at 48h; F, F’), oxytocinergic neurons (oxt at 72h; G, G’), and hypocretinergic neurons (hcrt at 72h; H, H’). F-H, lateral view; F’-H’, dorsal view. Scale bar, 200 μm |
|
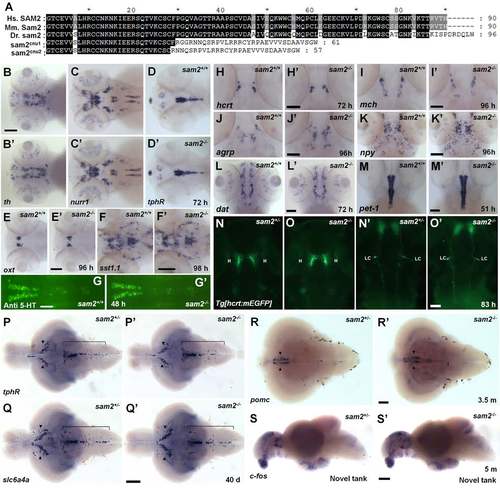
Normal expressions of various neuronal markers in sam2cnu1 KO fish. (A) Alignment of human, mouse, and zebrafish Sam2 peptides. Putative amino acid sequences of mutant forms are also aligned. Dopaminergic neuron (th, B-B’; nurr1, C-C’; dat, L-L’), serotonergic neuron (tphR, D-D’; 5-HT, G-G’; pet-1, M-M’), oxytocinergic neuron (oxt, E-E’), and IPN (sst1, F-F’) markers. Additional neural markers: hcrt (H-H’), mch (I-I’), agrp (J-J’), and npy (K-K’). (N-O’) Normal hypothalamus (H) - locus coeruleus (LC) axonal connections in sam2cnu1 KO fish as judged by Tg[hcrt:EGFP] transgene expression. Dorsal views, anterior to the top. Scale bar, 100 μm. (P-R’) Serotonergic neuron (tphR, slc6a4a) and adrenocorticotropic hormone precursor pomc marker in adult brain. Arrowheads indicate the ventral posterior tuberculum (P-Q’) and the nucleus lateralis tuberis (R, R’). Bracket defines the raphe (P-Q’). (S-S’) c-fos expression in the novel tank assay. Scale bar, 500 μm. EXPRESSION / LABELING:
|

