
Fig. S5
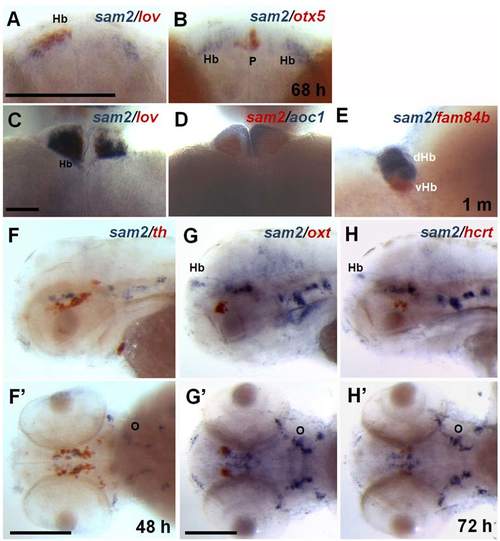
Characterization of sam2-expressing cell populations in larval zebrafish. Two-color whole-mount in situ hybridization was performed to identify sam2-positive cells, comparing with known habenula (Hb) markers: lov (kctd12.1), dorsal Hb (dHb); aoc1, ventral Hb (vHb); fam84b, both dHb and vHb marker; otx5, pineal organ (p) marker. (A, B) 68 hour-old larvae. Dorsal view. (C-E) Adult brain. Dorsal view, except for lateral view in (E). Note the specific expression of sam2 in the dorsal Hb. Other than Hb, sam2-expressing cells do not overlap with markers of dopaminergic neurons (th at 48h; F, F’), oxytocinergic neurons (oxt at 72h; G, G’), and hypocretinergic neurons (hcrt at 72h; H, H’). F-H, lateral view; F’-H’, dorsal view. Scale bar, 200 μm |