
- Title
-
A metabolic switch controls intestinal differentiation downstream of Adenomatous polyposis coli (APC).
- Authors
- Sandoval, I.T., Delacruz, R.G., Miller, B.N., Hill, S., Olson, K.A., Gabriel, A.E., Boyd, K., Satterfield, C., Remmen, H.V., Rutter, J., Jones, D.A.
- Source
- Full text @ Elife
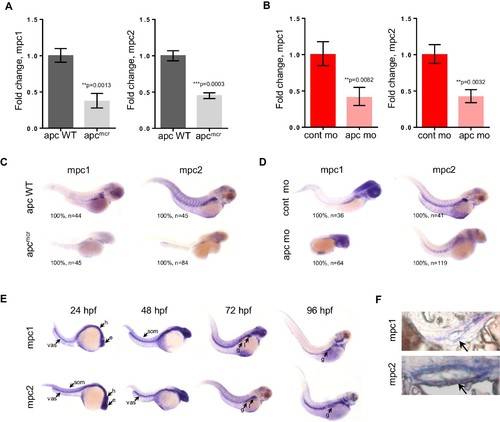
mpc1 and mpc2 are downregulated in apcmcr and apc morphant embryos. (A,B) Quantitative RT-PCR analysis of mpc1 and mpc2 gene expression in apcmcr (A) and apc mo (B) embryos. Values represent mean ± SD. Graph shown above is representative of at least three independent experiments. Statistical significance was analyzed using unpaired t-test. (C,D) Whole mount in situ hybridization for mpc1 and mpc2 in 72 hpf apcmcr (C) and apc mo (D) embryos. (E) Whole mount in situ hybridization for mpc1 and mpc2 in wild type (WT) embryos. head (h), eyes (e), somite (som), vasculature (vas), gut (g), liver (l). (F) Cross sections from 96 hpf WT embryos probed with either mpc1 or mpc2 confirmed gut-specific expression of both genes. See also Figure 1—figure supplement 1. EXPRESSION / LABELING:
PHENOTYPE:
|
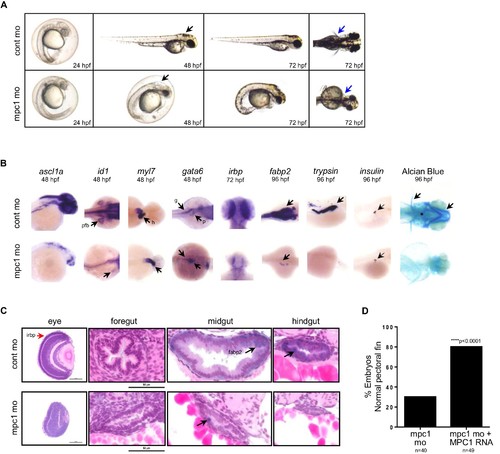
Knock down of mpc1 expression phenocopies loss of apc. (A) Gross phenotype associated with mpc1 knock down. (B) Whole mount in situ hybridization analysis for organ-specific markers in mpc1 mo. Alcian blue staining revealed improper cartilage development (*) and confirmed loss of pectoral fins in mpc1 mo. pectoral fin bud (pfb), heart (h), gut (g), pancreas (p). (C) Cross section of the eye and gut from control or mpc1 mo. Prior to sectioning, embryos were previously stained with eye and gut-specific markers, irbp (red arrow) and fabp2 (black arrow), respectively. (D) Co-injection with human MPC1 RNA led to increased percentage of mpc1 mo with normal pectoral fins as determined by in situ staining for idi1. Statistical significance was analyzed using Fisher’s exact test. See also Figure 2—figure supplements 1, 2. EXPRESSION / LABELING:
PHENOTYPE:
|
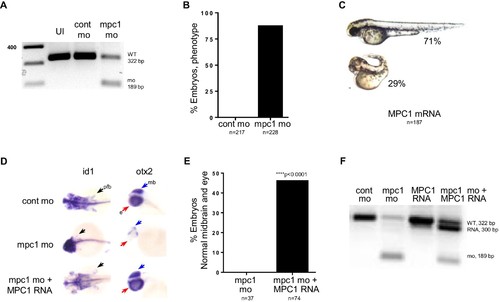
mpc1 morphant phenotype is rescued by human MPC1 RNA. (A) PCR analysis amplifying mpc1 WT (322 bp) or morphant band (189 bp). Un-injected embryos (UI) served as a second control group. (B) Observed penetrance for mpc1 morpholino. (C) Observed phenotype for MPC1 mRNA overexpression in WT embryos. (D) Rescue of pectoral fins (pfb) and underdeveloped midbrain (mb) in 72 hpf mpc1 mo co-injected with human MPC1 RNA (mpc1 mo + MPC1 RNA) was determined by in situ hybridization for id1 and otx2, respectively. (E) Quantification of embryos with normal midbrain and eye development as measured by otx2 staining. Statistical significance was analyzed using Fisher’s exact test. (F) PCR analysis confirming presence of human MPC1 transcript (300 bp) in 48 hpf embryos. |
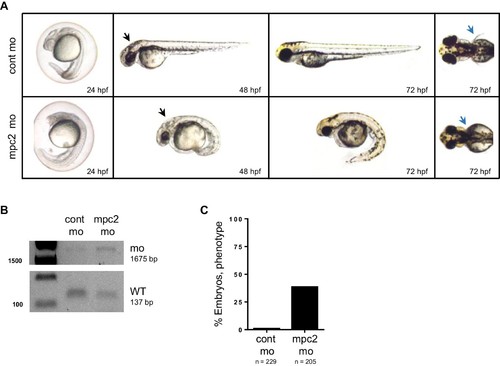
mpc2 morphants phenocopy loss of mpc1. (A) Knockdown of mpc2 expression in WT embryos (mpc2 mo) resulted in phenotypes previously described for mpc1 morphants including enlarged hindbrain (black arrows), body deformities and absence of pectoral fins (blue arrows). (B) PCR analysis using primers specific for amplifying mpc2 WT (137 bp) or morphant band (1675 bp) confirmed knockdown of mpc2 expression in 48 hpf embryos. (C) Observed penetrance for mpc2 morpholino. PHENOTYPE:
|

MPC1 rescues gut phenotype of apc mo and apcmcr. (A,B) In situ hybridization for fabp2, in 72 hpf WT embryos injected with cont mo, apc mo or both apc mo and human MPC1 RNA (apc mo + MPC1 RNA) (A). In situ hybridization for fabp2 in 72 hpf apc WT, apcmcr or apcmcr injected with human MPC1 mRNA (apcmcr + MPC1 RNA) (B). (C,D) Quantification of injected embryos with differentiated gut as determined by fabp2 staining. Statistical significance was analyzed using Fisher’s exact test. EXPRESSION / LABELING:
PHENOTYPE:
|

Knock down of mpc1 or apc leads to altered mitochondrial respiration and pyruvate metabolism. (A) Mitochondrial respiration was evaluated by measuring oxygen consumption rates (OCR) in 72 hpf embryos. (B) Triglyceride (TG) levels were determined in lysates prepared from 72 hpf embryos using a colorimetric assay. (C,D) Quantitative RT-PCR analysis of enzymes involved in pyruvate metabolism in apc mo and (C) apcmcr (D) embryos. pyruvate dehydrogenase alpha 1a (pdha1a); pyruvate dehydrogenase kinase, isozyme 1 (pdk1); pyruvate kinase, muscle, a (pkma); citrate synthase (cs). (E) Lactate levels in apc wild type (WT), un-injected apcmcr (UI) or apcmcr embryos injected with human MPC1 mRNA (MPC1 RNA). For figures A–E, values represent mean ± SD. Graph shown above is representative of at least three independent experiments. Statistical significance was analyzed using unpaired t-test. (F,G,H) Gross phenotype (F), alcian blue staining (G) and in situ hybridization for fabp2 (H) in pdha1a, pcxb, and pcxb + pdha1a mo. pcxb (pyruvate carboxylase b). See also Figure 4—figure supplements 1, 2. EXPRESSION / LABELING:
|

ZFIN is incorporating published figure images and captions as part of an ongoing project. Figures from some publications have not yet been curated, or are not available for display because of copyright restrictions. EXPRESSION / LABELING:
PHENOTYPE:
|
|
ZFIN is incorporating published figure images and captions as part of an ongoing project. Figures from some publications have not yet been curated, or are not available for display because of copyright restrictions. EXPRESSION / LABELING:
PHENOTYPE:
|