
- Title
-
Platelet-derived growth factor (PDGF) signaling directs cardiomyocyte movement toward the midline during heart tube assembly
- Authors
- Bloomekatz, J., Singh, R., Prall, O.W., Dunn, A.C., Vaughan, M., Loo, C.S., Harvey, R.P., Yelon, D.
- Source
- Full text @ Elife
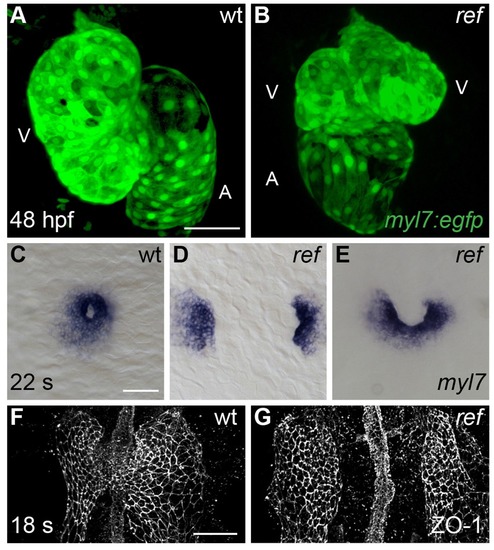
Cardiac fusion defects in refuse-to-fuse (ref) mutants. (A,B) Three-dimensional reconstructions depict wild-type (wt) and ref mutant hearts expressing the myocardial reporter transgene Tg(myl7:egfp) at 48 hpf. In contrast to the normal contours of the wt heart (A), the ref mutant heart (B) often displays a bifurcated, two-lobed ventricle and a misshapen atrium. See Figure 1—figure supplement 1 and Table 1 for more information on the range of cardiac phenotypes observed in ref mutants at 48 hpf. A: atrium; V: ventricle. (C–G) Dorsal (C–E) and ventral (F,G) views, anterior to the top, of wt (C,F) and ref (D,E,G) mutant embryos displaying the expression of myl7 at the 22 somite stage (22 s; C–E) and the localization of ZO-1 at the 18 somite stage (18 s; F,G). (C–E) In ref mutants at this stage, cardiomyocytes typically fail to fuse at the midline (D) or only fuse posteriorly (E). Note that the ref mutation is incompletely penetrant, although its penetrance is more evident at 20 s than at 48 hpf (Table 2), suggesting that some ref mutants recover as development proceeds. (F,G) ZO-1 localization highlights junctions forming within the maturing epithelium of the ALPM in both wt and ref mutant embryos. The ventral portion of the neural tube located at the midline is also visible. By 18 s, the wt ALPM (F) has initiated fusion at the midline, whereas the two sides of the ref mutant ALPM are still separate (G). Scale bars: 60 μm. EXPRESSION / LABELING:
PHENOTYPE:
|
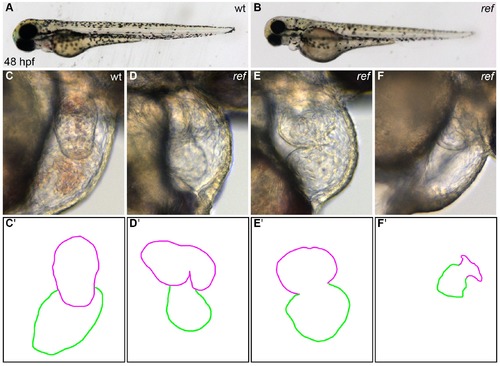
ref mutant embryos display a range of cardiac defects. (A,B) Lateral views of live wild-type (wt, A) and ref mutant (B) embryos at 48 hpf. ref mutants exhibit a mild pericardial edema. (C–F) Lateral views from the right side of wt (C) and ref mutant (D–F) hearts reveal a variety of abnormal cardiac morphologies in ref mutants. The most commonly observed phenotype was a bifurcated ventricle (D), some other embryos exhibited abnormal looping (E) or a severely shrunken heart (F), and a few embryos had cardia bifida (not shown). See Tables 1 and 2 for more information regarding the incomplete penetrance and variable expressivity of the ref mutant phenotype. (C'–F') Cartoons outline the cardiac morphologies shown in C–F, with the ventricle in magenta and the atrium in green. |
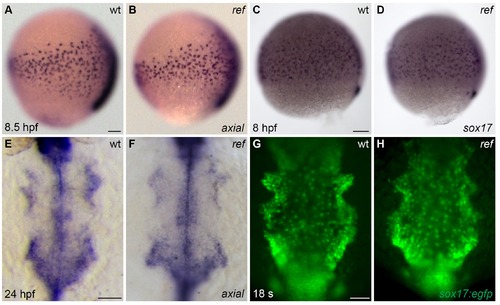
The anterior endoderm forms normally in ref mutant embryos. (A–D) Lateral views, dorsal to the right, depict the expression of axial at 8.5 hpf (A,B) or sox17 at 8 hpf (C,D). The number and distribution of endoderm precursor cells is similar in wt (A,C) and ref mutant (B, n = 8/8; D, n = 14/14) embryos during gastrulation stages. (E–H) Dorsal views, anterior to the top, depict the anterior endoderm, visualized with the expression of axial at 24 hpf (E,F) or the endodermal reporter transgene Tg(sox17:egfp) at 18 s (G,H). The width and morphology of the anterior endoderm is similar in wt (E,G) and ref mutant (F, n = 13/13; H, n = 7/7) embryos during the stages when cardiac fusion takes place. Scale bars: 60 μm. |

Endocardial cells move to the midline in ref mutant embryos. (A,B) Dorsal views, anterior to the top, depict the expression of the endothelial reporter transgene Tg(fli1a:negfp) in the endocardial precursor population at 18 s (n = 8). In both wt (A) and ref mutant (B) embryos, the endocardial precursors move to the midline during the process of cardiac fusion. Scale bar: 60 μm. EXPRESSION / LABELING:
PHENOTYPE:
|

ref is a loss-of-function mutation in pdgfra. (A) Polymorphic markers (z21170, kdr_e28, 5’scfd2, z14614) were used to map meiotic recombination events, narrowing the region containing the ref mutation to <0.1 cM on linkage group (LG) 20. (See also Table 3). Fractions indicate frequencies of proximal (magenta) and distal (green) recombination between markers and ref. Six annotated genes are present in this region (GRCv10); sequence analysis of kdr, kita, gsx2, lnx1, and fip1l1a in ref mutants revealed only missense mutations that led to conserved amino acid changes. (B) RT-PCR spanning exons 13–19 of pdgfra generates a single, properly spliced product from homozygous wt embryos and multiple, smaller products from ref mutant embryos. Sequencing revealed that exon 14 was either omitted or truncated in these smaller products; in all cases, the observed missplicing would result in a frameshift followed by a premature stop codon. Although we did not detect any normally spliced pdgfra products in ref mutants, we cannot rule out the presence of low levels of wild-type mRNA. RT-PCR of gapdh demonstrates use of comparable amounts of template. (C,D) Sequencing the e14i15 exon-intron boundary of pdgfra revealed that ref mutant genomic DNA contains a G-to-A mutation in a conserved intronic nucleotide required for proper splicing. Chromatograms (C) and sequence alignment (D) show position of the mutation relative to reference sequences. Schematics (D) depict the proteins predicted to result from the wt, ref, and b1059 alleles of pdgfra; immunoglobulin (magenta), transmembrane (green), and tyrosine kinase (blue) domains are shown. (E,F) Lateral views depict expression of pdgfra at 11 s. Expression levels are lower in ref mutants (F; n = 5/5) than in wt (E). (G–J) Dorsal views, anterior to the top, of myl7 expression at 22 s. In contrast to wt (G), cardiac fusion defects are evident in embryos injected with a pdgfra morpholino (MO) (H), b1059 homozygous mutant embryos (I), and ref/b1059 transheterozygous mutant embryos (J). See Figure 2—figure supplement 2 for additional information on the prevalence of each of these phenotypes. Scale bars: 60 μm. EXPRESSION / LABELING:
PHENOTYPE:
|
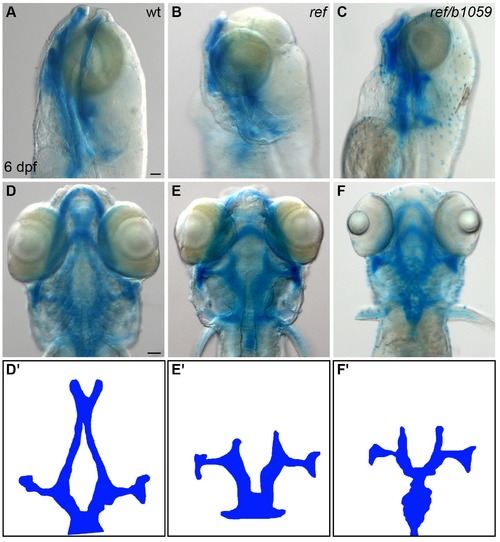
ref mutants display craniofacial defects. (A–F) Lateral (A–C) and ventral (D–F) views of embryos at 6 days post-fertilization (dpf), stained with Alcian blue to show the dorsal and ventral cartilage in the head. Embryos homozygous for ref (B,E; n = 9/9) or transheterozgous for ref and b1059 (C,F; n = 5/6) display similar dorsal cartilage formation defects. Specifically, the dorsal ethmoid plate is diminished or absent in these mutants. Scale bars: 60 μm. (D'–F') Cartoons illustrate the dorsal cartilage structures shown in D–F. PHENOTYPE:
|
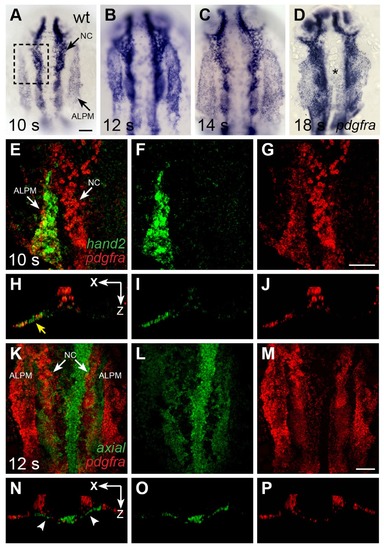
pdgfra is expressed within the ALPM while cardiac fusion is underway. (A–D) Dorsal views, anterior to the top, depict pdgfra expression in wt embryos at 10 s (A), 12 s (B), 14 s (C), and 18 s (D). Arrows (A) indicate pdgfra expression in the ALPM and the neural crest (NC). Asterisk (D) denotes position of the myocardium by 18 s; although pdgfra is expressed in the myocardial precursors within the ALPM at earlier stages, its expression in these cells appears to be gone by this time point. (E–J) Comparison of hand2 (green) and pdgfra (red) expression patterns demonstrates their overlap in the wt ALPM at 10 s. (E–G) Three-dimensional confocal reconstructions of dorsal views, anterior to the top, focused on the left side of the ALPM (area outlined by a dashed box in (A). Arrows (E) indicate pdgfra expression in the ALPM and the NC. ( EXPRESSION / LABELING:
|
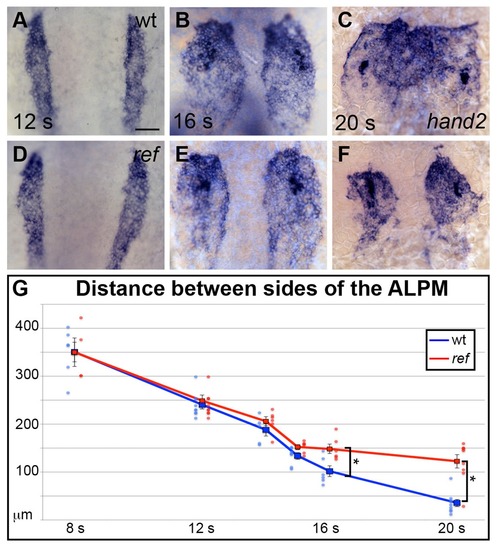
pdgfra influences the movement of the ALPM after the 15 somite stage. (A–F) Dorsal views, anterior to the top, depict expression of hand2 in the wt (A–C) and ref mutant (D–F) ALPM from 12 to 20 s. The morphology and position of the ALPM are indistinguishable in wt (A) and ref mutant (D) embryos at 12 s. After 15 s (B,C,E,F), disrupted movement of the ALPM is evident in ref mutants. Scale bar: 60 μm. (G) Graph illustrates the average distance between the two sides of the ALPM in wt and ref mutant embryos from 8 to 20 s. In each embryo, the distance between the sides of the ALPM was calculated by measuring the distance between the medial edges of the hand2-expressing domains at three equidistant points (200 μm apart) along the anterior-posterior axis. The largest of those three measurements was selected as representative of the maximum distance between the bilateral ALPM domains for that embryo. Dots represent the selected measurements from individual embryos. The distance between the bilateral sheets in ref mutant embryos begins to diverge significantly from wt after 15 s. Error bars represent the standard error. Asterisks indicate p<0.05 (Student’s t-test): p=0.99 at 8 s; p=0.58 at 12 s; p=0.30 at 14 s; p=0.053 at 15 s; p=0.012 at 16 s; and p=0.00012 at 20 s. EXPRESSION / LABELING:
PHENOTYPE:
|
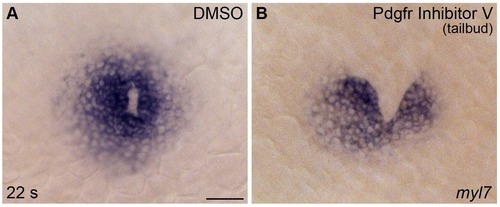
PDGF signaling is required after gastrulation for proper cardiac fusion. (A,B) Dorsal views, anterior to the top, display myl7 expression at 22 s in representative embryos treated with DMSO (A) or Pdgfr inhibitor V (B) from the tailbud stage until 22 s. DMSO-treated control embryos exhibited normal cardiac fusion, whereas treatment with Pdgfr inhibitor V disrupted cardiac fusion. See Figure 2—figure supplement 2 for additional information on the prevalence of these phenotypes. Scale bar: 60 μm. |
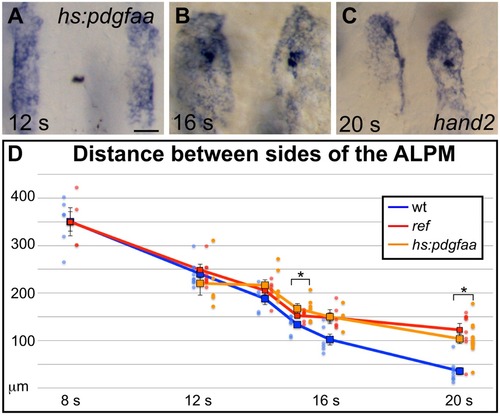
Overexpression of pdgfaa influences ALPM movement by the 15 somite stage. (A–C) Dorsal views, anterior to the top, depict expression of hand2 in the ALPM of Tg(hsp70l:pdgfaa-2A-mCherry) embryos from 12 to 20 s, following heat shock at the tailbud stage. See Figure 5A–C for images of representative wt embryos at the same stages. Overexpression of pdgfaa at the tailbud stage does not seem to affect the morphology and position of the ALPM at 12 s (A), but it does disrupt ALPM movement by 16 s (B) and 20 s (C). Scale bar: 60 μm. (D) Graph illustrates the average distance between the two sides of the ALPM from 12 to 20 s in Tg(hsp70l:pdgfaa-2A-mCherry) embryos, following heat shock at the tailbud stage, shown together with the data presented in Figure 5G. The distance between the sides of the ALPM domains in transgenic embryos was measured as described for Figure 5G. Dots represent measurements from individual embryos. The distance between the bilateral sheets of ALPM in Tg(hsp70l:pdgfaa-2A-mCherry) embryos begins to diverge significantly from wt by 15 s. Error bars represent the standard error. Asterisks indicate p<0.05 in comparison to wt embryos (Student’s T-test): p=0.47 at 12 s; p=0.12 at 14 s; p=0.024 at 15 s; p=0.090 at 16 s; and p=0.000027 at 20 s. |
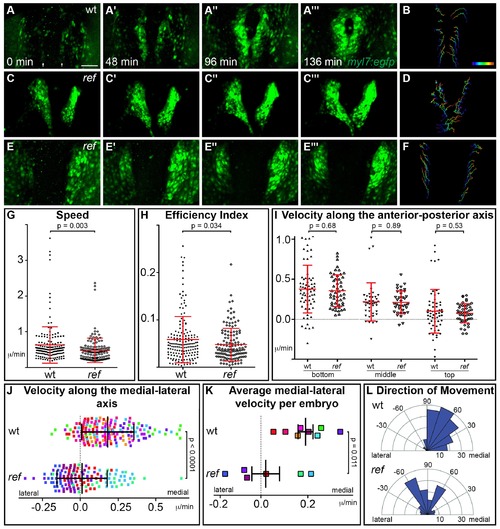
pdgfra regulates the directionality of cardiomyocyte movement. (A–F) Representative timelapse experiments indicate patterns of cell movement in wt (A,B) and ref mutant (C–F) embryos carrying the Tg(myl7:egfp) transgene. (A,C,E) Three-dimensional confocal reconstructions of select timepoints within each timelapse depict the typical changes in myocardial morphology seen over time in wt (A), mildly affected ref mutant (C) and severely affected ref mutant (E) embryos. (B,D,F) Tracks show the movements of the innermost cardiomyocytes in these embryos over the course of a ~2 hr timelapse. Cell tracks are colored from blue to red, indicating the location of each cell from the beginning to the end of its trajectory. See also Videos 1–3. Scale bar: 60 μm. (G–L) Quantitative analysis of cardiomyocyte movements. 168 and 137 cells were analyzed from eight wt and six ref mutant embryos, respectively. Graphs depict the average speed of individual cells (G, distance/time), the average efficiency index of individual cells (H, displacement/distance), the average velocity (displacement/time) of individual cells along the anterior-posterior axis (I) and along the medial-lateral axis (J), the average medial-lateral velocity per embryo (K), and the direction of the overall trajectory of individual cells (L). Dots in (J) are colored to depict the embryo to which they belong, and the same color scheme is used in (K). In (L), individual cells are grouped into 10 bins based on their net direction of movement; length of each radial bar represents the number of cells in each bin. The velocity along the medial-lateral axis (J,K) and the direction of cell trajectories (L) were significantly altered in ref mutants, indicating the misdirection of ref mutant cardiomyocytes and implicating pdgfra in steering the medial direction of cardiomyocyte movement. Error bars represent the standard deviation; p values were determined using Student’s T-test. EXPRESSION / LABELING:
PHENOTYPE:
|
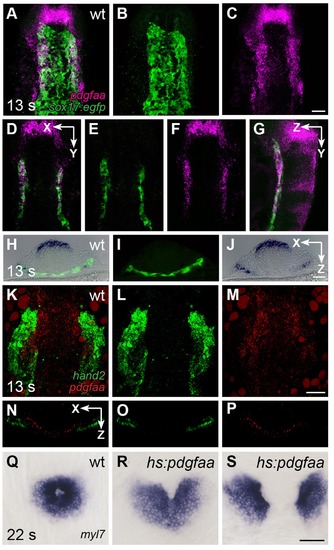
pdgfaa is expressed in the anterior endoderm, medially adjacent to the ALPM. (A–G) Fluorescent in situ hybridization and immunofluorescence compare the expression of pdgfaa (magenta) and Tg(sox17:egfp) (green) in wt embryos at 13 s. (A–C) Dorsal views, anterior to the top, of a three-dimensional reconstruction show that pdgfaa is expressed in bilateral domains of the anterior endoderm, near the lateral edges of the endodermal sheet. Expression of pdgfaa is also evident in cranial rhombomeres. (D–F) A coronal (XY) slice of the same embryo demonstrates the overlap between pdgfaa and Tg(sox17:egfp) expression. (G) A sagittal (ZY) slice of the same embryo provides a lateral view. (H–J) Transverse cryosections compare the expression of pdgfaa (blue) and the expression of Tg(sox17:egfp) (green) in wt embryos at 13 s, showing that pdgfaa is expressed in lateral domains of the endodermal sheet. (K–P) Comparison of hand2 (green) and pdgfaa (red) expression patterns demonstrates that pdgfaa is expressed medially adjacent to the domains of hand2 expression in the ALPM. (K–M) Three-dimensional confocal reconstructions of dorsal views, anterior to the top. (N–P) Single transverse (XZ) slices from (K–M), respectively. (Q–S) Dorsal views, anterior to the top, display the expression of myl7 at 22 s in nontransgenic (Q) or Tg(hsp70l:pdgfaa-2A-mCherry) (R,S) embryos, following heat shock at the tailbud stage. Ectopic expression of pdgfaa causes cardiac fusion defects. See Figure 2—figure supplement 2 and Figure 5—figure supplement 2 for additional information regarding this phenotype. Scale bars: 60 μm. EXPRESSION / LABELING:
PHENOTYPE:
|
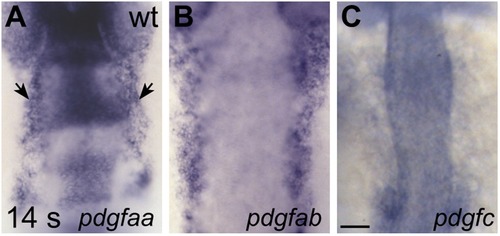
Expression of genes encoding Pdgfra ligands. (A–C) Dorsal views, anterior to the top, display expression of pdgfaa (A), pdgfab (B), and pdgfc (C) in wt embryos at 14 s. Since Pdgfa homodimers and Pdgfc homodimers have been shown to interact with Pdgfra (Andrae et al., 2008), we chose to examine the expression of the two zebrafish Pdgfa homologs, pdgfaa and pdgfab, as well as the expression of pdgfc (Eberhart et al., 2008). Both pdgfaa (A) and pdgfab (B) are expressed in bilateral medial stripes (arrows, A), consistent with the location of the anterior endoderm. We detected pdgfc (C) expression in the otic vesicles and somites at 14 s, but we did not detect expression over background levels within the anterior endoderm. Scale bar: 60 μm. EXPRESSION / LABELING:
|