
- Title
-
Bmp15 Is an Oocyte-Produced Signal Required for Maintenance of the Adult Female Sexual Phenotype in Zebrafish
- Authors
- Dranow, D.B., Hu, K., Bird, A.M., Lawry, S.T., Adams, M.T., Sanchez, A., Amatruda, J.F., Draper, B.W.
- Source
- Full text @ PLoS Genet.
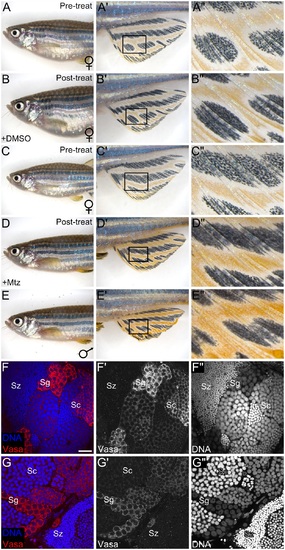
(A-A′′) Representative Tg(zp3:CFP-NTR) female prior to control DMSO-treatment and the same fish (B-B′′) post-treatment. Female zebrafish (A-B′′) have large, egg-filled abdomens and light yellow fin pigmentation. (C-C′′) Representative Tg(zp3:CFP-NTR) female prior to Mtz treatment and the same fish (D-D′′) two months after Mtz treatment. Note that the post-treatment fish has a slimmer body and darker yellow fin pigmentation characteristic of a DMSO-treated control male (E-E′′). (F-G′′) Confocal images of testes isolated from a normal male (F-F′′) and a representative sex-reverted Tg(zp3:CFP-NTR) (G-G′′) fish. (F, G) Merged images: Vasa protein in red, DNA in blue. (F′, G′) Vasa protein only. (F′′, G′′) DNA only. (A′-E′) Magnified view of the anal fin. (A′′-E′′) Magnified view of the regions boxed in A′-E′. Sg, spermatogonia; Sc, spermatocytes; Sz, spermatozoa. Scale bar: 20 µm (F-G′′). |
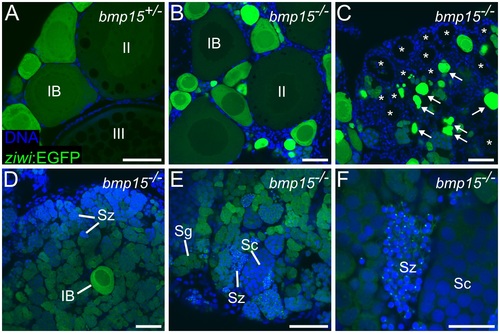
(A-F) ziwi:EGFP expression in gonads of bmp15+/- and bmp15-/- females at 80 dpf. (A) Representative bmp15+/- ovary with stage IB, stage II, and stage III oocytes indicated. (B-F) Representative regions of a single bmp15-/- gonad depicting stage IB and stage II oocytes (B), evidence of oocyte degradation and loss (C), spermatogonia surrounding a single stage IB oocyte (D), and a region containing all stages of spermatogenesis (E), including mature sperm (magnified in F). ziwi:EGFP in green, DNA in blue. Arrows indicate degrading oocytes and asterisks indicate empty follicles. Sg, spermatogonia; Sc, spermatocytes; Sz, spermatozoa. Scale bars: 50 µm (A-E), 20 µm (F). EXPRESSION / LABELING:
PHENOTYPE:
|
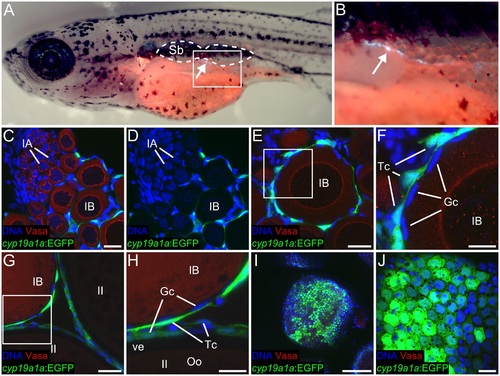
(A-C) cyp19a1a:EGFP expression in the gonad at 16 dpf. (A) Anterior body of 16 dpf TgBAC(cyp19a1a:EGFP) fish showing GFP-expressing somatic gonad cells (arrow) located below the swim bladder (outlined). (B) Magnified view of the region boxed in (A). (C-F) cyp19a1a:EGFP is expressed in theca cells that surround stage IB and later stage oocytes (E-H), but not IA oocytes or premeiotic germ cells (C, D), as observed here in a 40 dpf ovary. (F) Magnified view of the region boxed in (E). (G-J) cyp19a1a: EGFP is expressed in both theca and granulosa cells that surround stage II and later stage oocytes, as observed here in a 60 dpf ovary. (H) magnified view of region boxed in (G). (I, J) low and high magnification views of cyp19a1a:EGFP expression in granulosa cells that are on the surface of a stage III oocyte. In all images, cyp19a1a:EGFP is green, Vasa protein is red and DNA is blue. Sb, swim bladder; IA, stage IA oocytes; IB, stage IB oocyte; II, stage II oocyte; Tc, theca cell; Gc, granulosa cell; Oo, oocyte; ve, vitelline envelope. Scale bars: 20 µm in C (for C, D, E, G, J), 10 µm in F (for F and H), 150 µm (I). EXPRESSION / LABELING:
|
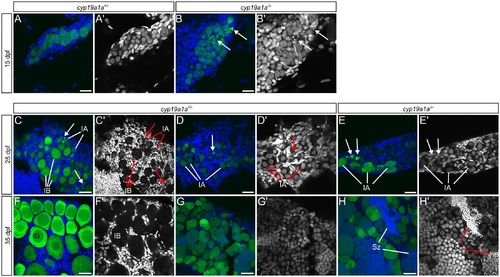
(A-H′) cyp19a1a heterozygous (A, C, D, F, G) and mutant (B, E, H) gonads at 15 (A-B′), 25 (C-E′), and 35 (F-H′) dpf. Wild-type presumptive ovary (C) and ovary (F). Wild-type presumptive testis (D) and testis (G). Mutant presumptive testis (E) and testis (H). (A-H) Merged images: ziwi:EGFP in green, DNA in blue. (A′-H′) DNA only. Arrows indicate degrading germ cells. IA, stage IA oocyte; IB, stage IB oocyte; Sz, spermatozoa Scale bars: 20 µm (A-E), 50 µm (F -H′). EXPRESSION / LABELING:
PHENOTYPE:
|
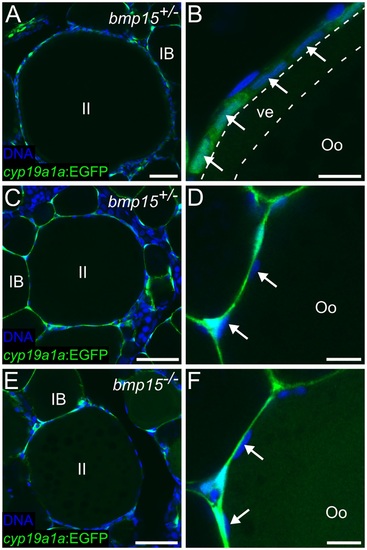
(A) The maximum sized oocytes observed in 55 dpf bmp15+/- ovaries are mid stage II (~280 µm in diameter), while the maximum sized oocytes observed in bmp15-/- sibling ovaries are early stage II, (~150 µm in diameter; E). (B) Representative magnified view of a mid stage II oocyte follicle in bmp15+/- ovary showing cyp19a1a:EGFP -expressing granulosa cells (arrows) and a developed vitelline envelope (between dotted lines). (C) Representative early stage II oocyte found in 55 dpf bmp15+/- ovaries and magnified view in (D). (F) Representative magnified view of an early stage II oocyte follicle in TgBAC(cyp19a1a:EGFP);bmp15-/- ovaries showing that while GFP is expressed in theca cells (green), it is not expressed in any granulosa cells, as is the case for similarly staged bmp15+/- oocytes (C, D). In all images, cyp19a1a:EGFP is green and DNA is blue. IB, stage IB oocyte; II, stage II oocyte; Oo, oocyte; ve, vitelline envelope. Arrows indicate granulosa cell nucleus. Scale bars: 100 µm (A, C, E), 50 µm (B, D, F). EXPRESSION / LABELING:
PHENOTYPE:
|

(A) RT-PCR profiling of BMP receptor family members in ovarian tissue. Intact oocyte (consisting of oocyte plus associated follicle cells; left column) were mechanically separated into denuded oocyte (middle column) and follicle cell layer (right column). Reference genes mark follicle cells (lhcgr) and oocytes (vasa). Expression of the Type I receptor bmpr1bb and the Type II receptors bmpr2a and bmpr2b is selectively enriched in follicle cells. rpl13 is shown as an amplification control. High resolution fluorescent RNA in situ hybridization reveals that bmpr2a (green in B) is expressed in early oocytes and in the somatic gonad cells that surround them; bmpr2b (green in C, D) is expressed in somatic gonad cells that surround all oocytes; vasa (green in E) is only expressed in oocytes (B′-E′ are higher magnification views of areas boxed in B-E, respectively). In all panels DNA in blue. Dotted lines in B′-E′ mark the oocyte membrane; ve, vitelline envelope; IB, II and III denote oocyte stages. Scale bars: 100 µm (B-E), 20 µm (B′-E′). EXPRESSION / LABELING:
|
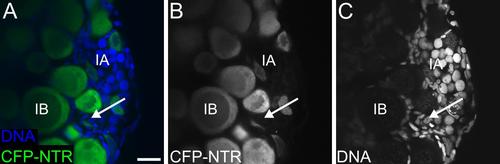
The zp3 promoter drives expression of CFP-NTR in oocytes but not premeiotic germ cells. (A-C) Expression of zp3:CFP-NTR in the ovary. (A) Merged image: CFP-NTR in green, DNA in blue. (B) CFP-NTR only. (C) DNA only. IB, stage IB oocyte. Arrow indicates premeiotic germ cell. Scale bar in A (for A-C): 20 µm. |
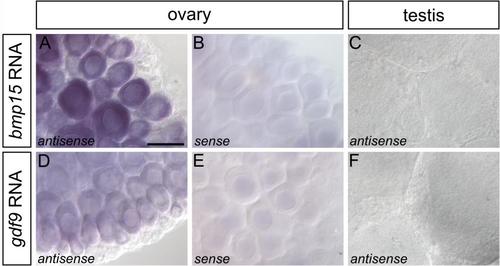
bmp15 and gdf9 are expressed in oocytes. (A-D) In situ hybridization for bmp15 and gdf9 RNA in 40 dpf wild-type gonads. (A) bmp15 and gdf9 (C) RNAs are detected in stage IB oocytes but not the smaller, more immature stage IA oocytes or premeiotic germ cells in ovaries. Neither transcript is detected in wild-type adult testes (B, D). Scale bar in A (for A-F): 50 µm. EXPRESSION / LABELING:
|
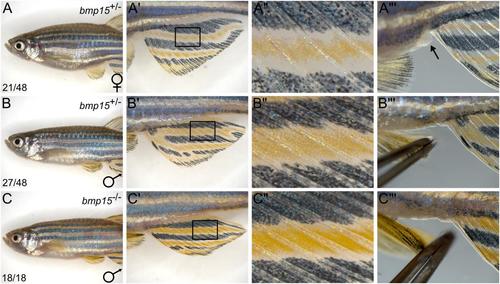
bmp15 mutants are males as adults. (A-A′′′) Adult bmp15+/- female. (B-B′′′) Adult bmp15+/- male. (C-C′′′) Representative adult bmp15-/- male. (A-C) Anterior body. (A′-C′) Magnified view of the anal fin. (A′′-C′′) Magnified view of the regions boxed in A′-C′. (A′′′-C′′′) Magnified view of the cloaca. While females (A′′′) have a prominent cloaca (arrow), males (B′′′, C′′′) do not. |
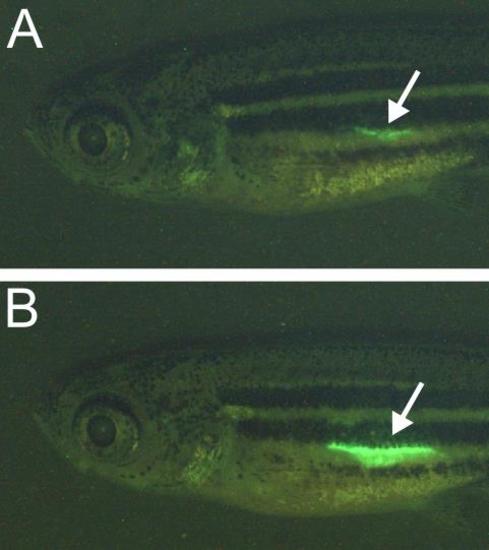
EGFP expression in germ cells identifies presumptive males and females.(A, B) EGFP expression in Tg(ziwi:EGFP) fish at 33 dpf. (A) EGFP expression is lowest in presumptive males but greater the larger gonads of presumptive females (B). Arrows indicate the gonad. |
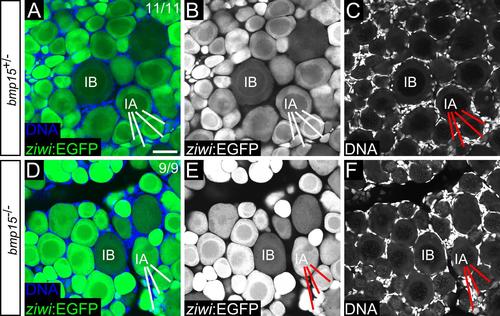
bmp15-/- mutant gonads are normal at 40 dpf. (A-C) bmp15+/- ovaries are indistinguishable from bmp15-/- ovaries (D-F). (A, D) Merged images: ziwi:EGFP in green, DNA in blue. (B, E) ziwi:EGFP only. (C, F) DNA only. IA, stage IA oocytes; IB, stage IB oocytes. Scale bar in A (for A-F): 50 µm. |
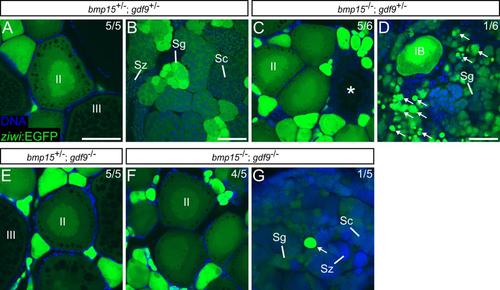
gdf9 does not play a role in sex determination or maintenance. bmp15; gdf9 double mutant analysis (A-G). bmp15+/-; gdf9+/- (A, B), bmp15-/-; gdf9+/- (C, D), bmp15+/-; gdf9-/- (E), bmp15-/-; gdf9-/-(F, G). ziwi:EGFP in green, DNA in blue. Arrows indicate degrading oocytes and asterisk indicates empty follicle. IB, II, III indicate oocyte stages. Sg, spermatogonia; Sc, spermatocytes; Sz, spermatozoa. Scale bars: 100 µm in A (for A, C, E, F and G), 25 µm (B), 50 µm (D). |
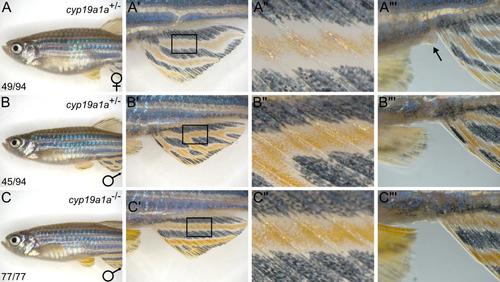
cyp19a1a mutants are males as adults. (A-A′′′) Adult cyp19a1a+/- female. (B-B′′′) Adult cyp19a1a+/- male. (C-C′′′) Representative adult cyp19a1a-/- male. (A-C) Anterior body. (A′-C′) Magnified view of the anal fin. (A′′-C′′) Magnified view of the regions boxed in A′-C′. (A′′′-C′′′) Magnified view of the cloaca. While females (A′′′) have a prominent cloaca (arrow), males (B′′′, C′′′) do not. |