
Fig. 5
- ID
- ZDB-IMAGE-161027-20
- Genes
- Publication
- Dranow et al., 2016 - Bmp15 Is an Oocyte-Produced Signal Required for Maintenance of the Adult Female Sexual Phenotype in Zebrafish
- All Figures
- Figures for Dranow et al., 2016
|
Fig. 5
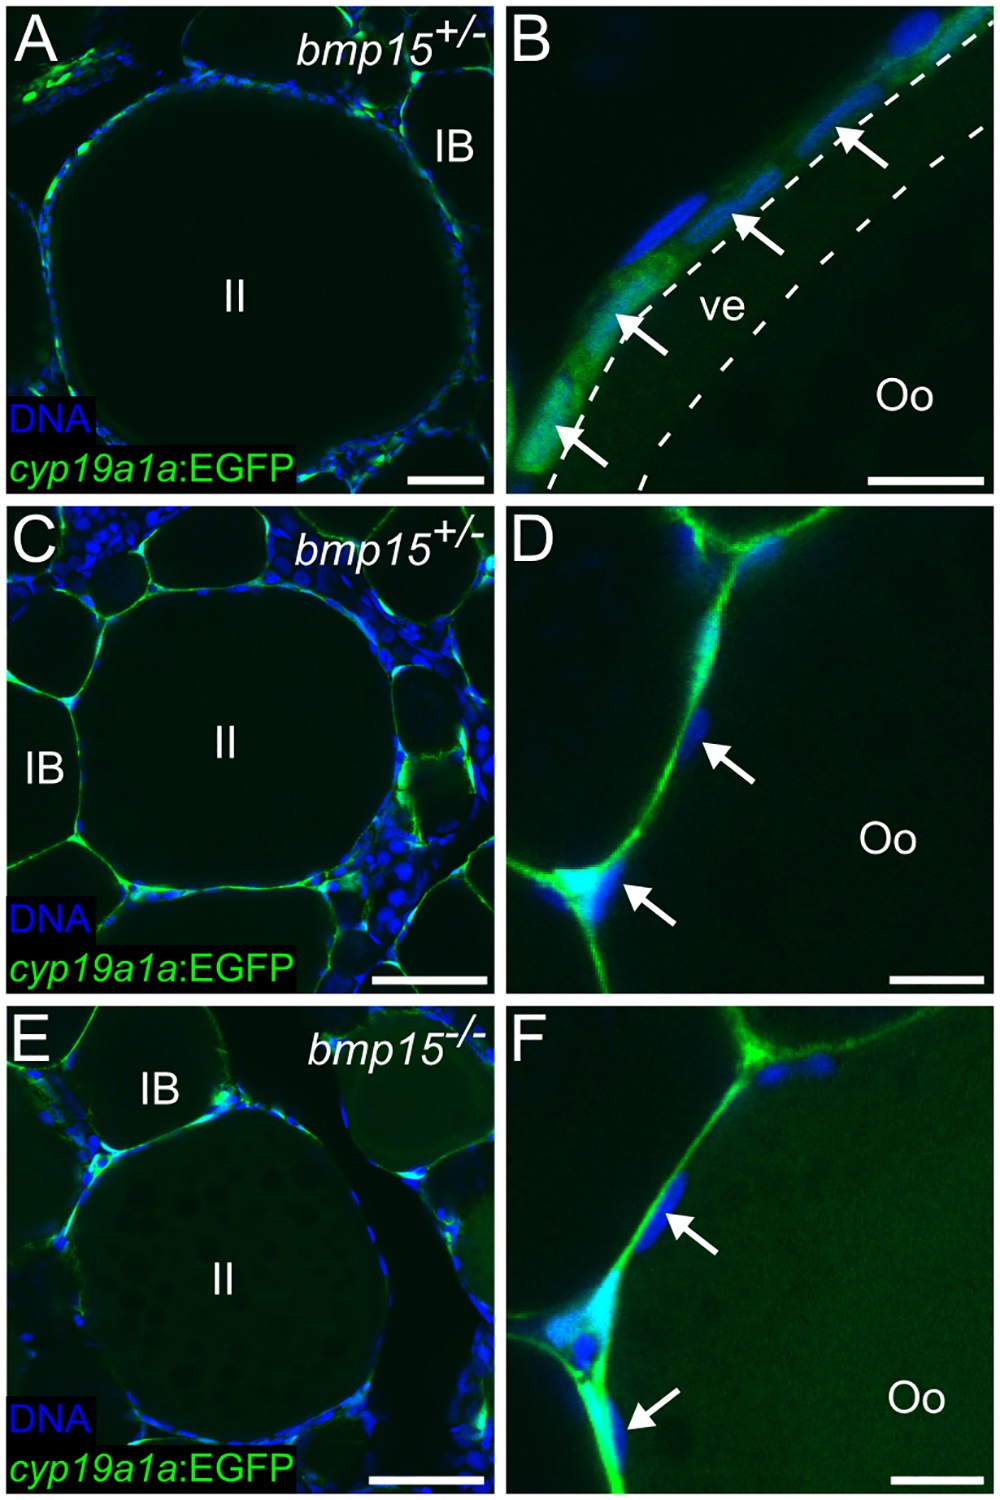
(A) The maximum sized oocytes observed in 55 dpf bmp15+/- ovaries are mid stage II (~280 µm in diameter), while the maximum sized oocytes observed in bmp15-/- sibling ovaries are early stage II, (~150 µm in diameter; E). (B) Representative magnified view of a mid stage II oocyte follicle in bmp15+/- ovary showing cyp19a1a:EGFP -expressing granulosa cells (arrows) and a developed vitelline envelope (between dotted lines). (C) Representative early stage II oocyte found in 55 dpf bmp15+/- ovaries and magnified view in (D). (F) Representative magnified view of an early stage II oocyte follicle in TgBAC(cyp19a1a:EGFP);bmp15-/- ovaries showing that while GFP is expressed in theca cells (green), it is not expressed in any granulosa cells, as is the case for similarly staged bmp15+/- oocytes (C, D). In all images, cyp19a1a:EGFP is green and DNA is blue. IB, stage IB oocyte; II, stage II oocyte; Oo, oocyte; ve, vitelline envelope. Arrows indicate granulosa cell nucleus. Scale bars: 100 µm (A, C, E), 50 µm (B, D, F).