
|
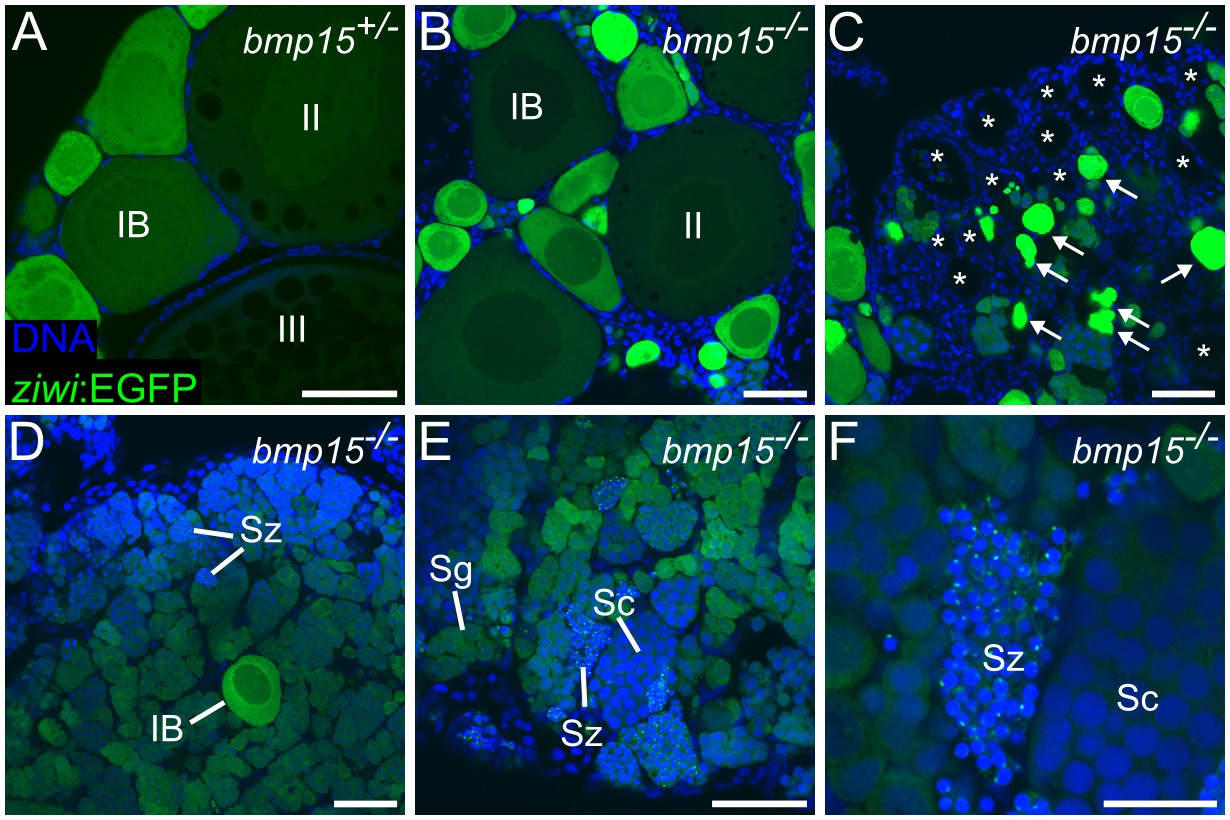
Fig. 2
(A-F) ziwi:EGFP expression in gonads of bmp15+/- and bmp15-/- females at 80 dpf. (A) Representative bmp15+/- ovary with stage IB, stage II, and stage III oocytes indicated. (B-F) Representative regions of a single bmp15-/- gonad depicting stage IB and stage II oocytes (B), evidence of oocyte degradation and loss (C), spermatogonia surrounding a single stage IB oocyte (D), and a region containing all stages of spermatogenesis (E), including mature sperm (magnified in F). ziwi:EGFP in green, DNA in blue. Arrows indicate degrading oocytes and asterisks indicate empty follicles. Sg, spermatogonia; Sc, spermatocytes; Sz, spermatozoa. Scale bars: 50 µm (A-E), 20 µm (F).