
- Title
-
Death Receptors DR6 and TROY Regulate Brain Vascular Development
- Authors
- Tam, S.J., Richmond, D.L., Kaminker, J.S., Modrusan, Z., Martin-McNulty, B., Cao, T.C., Weimer, R.M., Carano, R.A., van Bruggen, N., and Watts, R.J.
- Source
- Full text @ Dev. Cell
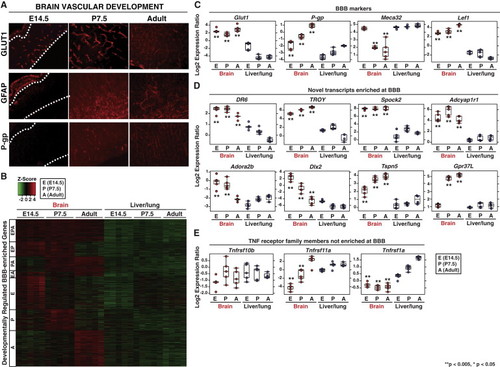
Blood-Brain Barrier Expression Profiling Identifies Genes Enriched in Brain Vasculature (A) Three blood-brain barrier (BBB) developmental time points identified by immunohistochemical analysis of GLUT1 expression and astrocyte localization in the mouse cortex. (GLUT1, endothelial cells; GFAP, astrocytes; P-gp, P-glycoprotein) Results representative of at least three independent experiments are shown. (B) Distinct developmentally regulated classes of BBB-specific transcripts were identified by microarray analysis. Samples are in columns; probes are in rows. Red and green color indicates over- or underexpression of probes in brain tissue relative to liver/lung tissue of the same stage, respectively. Developmental stage is indicated to the left of the heatmap (E, embryo; P, pup; A, adult). The probes shown in the heatmap are also presented in Table S1. (C) Expression profiling FACS-purified BBB and liver/lung vasculature shows enrichment of BBB markers Lef1, P-gp, and Glut1. (D) Selected transcripts enriched at the BBB. (E) TNF receptor family members Tnfrsf1a, 10b, and 11a are not preferentially expressed in CNS vasculature. Box and whisker plots indicate distribution of data and highlight median (horizontal line through box) and the 25th and 75th quartiles (box edges). Expression values were compared between brain and liver/lung tissue at each developmental stage. Statistical significance was defined as those stage-specific comparisons yielding an adjusted p value (**p < 0.005; *p < 0.05). Further details of statistical analysis are described in extended Experimental Procedures. See also Figure S1 and Table S1. |

Zebrafish Candidate-Based Genetic Screen Identifies Regulators of CNS Angiogenesis and Barriergenesis (A and B) Morpholino-mediated knockdown of BBB-enriched transcripts in Tg(kdrl:egfp) embryos. As described in Experimental Procedures, following a 4 ng morpholino injection, DAPI-positive brain parenchymal nuclei (Parenchymal DAPI; A: right panels) were visually isolated by computationally removing brain vasculature-derived DAPI signal from the DAPI channel. Results representative of at least three independent experiments are shown. Endothelial cells are green, DAPI is blue, rhodamine-dextran is red. MO, morpholino. (C) Quantification of DAPI leakage across the zebrafish BBB. n = 6 (control_MO), n > 6 (DR6_MO, TROY_MO, Spock2_MO, Adcyap1r1_MO, Tspn5_MO, and Tnfrsf1a_MO). Data are presented as the mean ± standard error of the mean (SEM) (***p < 0.005; **p < 0.01; *p < 0.05). See also Figure S2. EXPRESSION / LABELING:
PHENOTYPE:
|
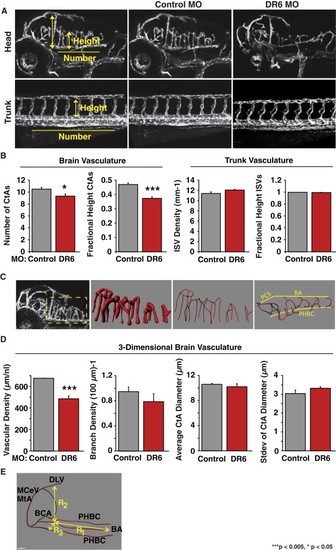
Zebrafish Blood-Brain Barrier Requires DR6 for CNS Angiogenesis (A) Translation-blocking morpholino-mediated DR6 knockdown leads to CNS-specific angiogenic defects in Tg(kdrl:egfp) embryos. Each embryo was treated with 4 ng morpholino. Results representative of at least three independent experiments are shown. MO, morpholino; CtA, central artery; ISV, intersegmental vessels. (B) 2D quantification of 3 dpf zebrafish CNS and trunk vasculature. n = 36 (control_MO), n = 15 (DR6_MO), see Experimental Procedures, Zebrafish Microangiographic Imaging and Quantification, for calculation of the fractional height of CtAs and ISVs. (C) 3D reconstructions of zebrafish hindbrain vasculature were used to create a vascular mask (second panel from the left) to determine vascular density and average CtA diameter. Filament tracing of the vessel-derived eGFP signal (first and second panels from the right) enabled branch density calculations. (D) 3D quantification of 3 dpf zebrafish hindbrain vasculature. Standard deviation of CtA diameter is a metric of irregularity in vessel lumenization. n = 4 (control_MO), n = 6 (DR6_MO). (E) Zebrafish brain volume calculation diagram. The volume of the half brain was approximated as V = R1R2R3. MtA, metencephalic artery; MCeV, middle cerebral vein; DLV, dorsal longitudinal vein; BCA, basal communicating artery; PHBC, primordial hindbrain channel; BA, basilar artery. Data are presented as the mean ± SEM (***p < 0.005; *p < 0.05). See also Figure S3 and mmc3VIDEO, mmc4VIDEO, mmc5VIDEO and mmc6VIDEO. EXPRESSION / LABELING:
PHENOTYPE:
|
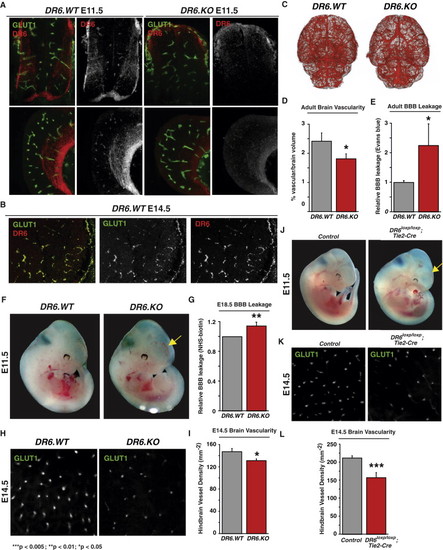
DR6 Is Required for Proper CNS Vascular Density and Barrier Function in Mice in a Cell-Autonomous Fashion (A) DR6 protein expression in CNS commissural axons and GLUT1-positive vasculature. Immunohistochemical staining for DR6 protein exhibited both neuronal and vascular signal in spinal cord (top panels) and forebrain (bottom panels) tissue from E11.5 embryos. This signal is specific to DR6 protein, as no antibody staining was apparent in DR6.KO embryos (right panels). Results representative of at least three independent experiments are shown. WT, wild-type; KO, knockout. (B) DR6 mRNA expression in Glut1-positive vasculature. Dual-target two-color fluorescent in situ hybridization was used to detect DR6 (red) and Glut1 (green) transcripts in mouse E14.5 brains. Results representative of at least three independent experiments are shown. (C) MicroCT angiographic surface renderings of adult mouse brain vasculature. 2D projections of DR6.WT and DR6.KO brains are shown. Results representative of six independent experiments are shown. (D) Quantification of microCT CNS vascular network. Vascular density was calculated as a function of vascular volume normalized by brain volume. n = 6 (DR6.WT), n = 6 (DR6.KO). (E) Evans blue leakage assay detects barrier defects in adult mice. n = 7 (DR6.WT), n = 8 (DR6.KO). (F) E11.5 DR6.KO embryos exhibit forebrain-specific hemorrhaging (observed in 60% embryos tested; arrow). Results representative of at least three independent experiments are shown. (G) Fixable biotin transcardiac perfusion assay detects barrier defects in E18.5 mouse embryos. n = 12 (DR6.WT), n = 12 (DR6.KO). (H) DR6.KO embryos exhibit reduced hindbrain vascular density at E14.5. Confocal images of flat-mounted hindbrains representative of at least nine independent experiments are shown. (I) Quantification of E14.5 mouse hindbrain vascular density. Vascular density was calculated as a function of number of GLUT1-positive hindbrain radial vessels normalized by field area. n = 12 (DR6.WT), n = 11 (DR6.KO). (J) E11.5 DR6flox/flox;Tie2-Cre embryos exhibit forebrain-specific hemorrhaging (observed in 80% embryos tested; arrow). Results representative of at least three independent experiments are shown. (K) E11.5 DR6flox/flox;Tie2-Cre embryos exhibit reduced hindbrain vascular density at E14.5. Confocal images of flat-mounted hindbrains representative of at least nine independent experiments are shown. (L) Quantification of E14.5 mouse hindbrain vascular density. Vascular density was calculated as described above. n = 15 (control), n = 11 (DR6flox/flox;Tie2-Cre). Data are presented as the mean ± SEM (***p < 0.005; **p < 0.01; *p < 0.05). See also Figure S4. |
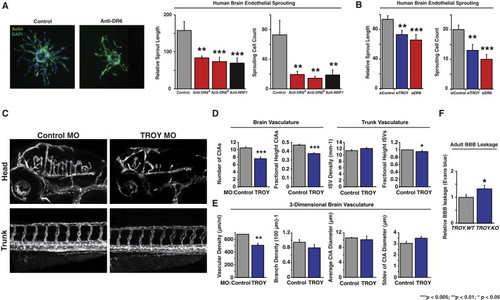
DR6 and TROY Are Required for Proper CNS Vascular Density and Barrier Function through Brain Endothelial Angiogenic Sprouting in a Cell-Autonomous Fashion (A) Anti-DR6 function-blocking antibodies reduce HBMEC sprouting. Actin is green, nuclei are blue (left). Results representative of at least three independent experiments are shown. Quantification of sprout length (middle) and number of sprouting cells (right) are shown. (B) siRNA-mediated knockdown of DR6 and TROY inhibits HBMEC sprouting. (C) Translation-blocking morpholino-mediated TROY knockdown leads to CNS-specific angiogenic defects. Each Tg(kdrl:egfp) zebrafish embryo was treated with 4 ng morpholino. Results representative of at least three independent experiments are shown. (D) 2D quantification of 3 dpf zebrafish vasculature. n = 36 (control_MO), n = 25 (TROY_MO). (E) 3D quantification of 3 dpf zebrafish hindbrain vasculature. n = 5 (control_MO), n = 6 (TROY_MO). (F) Evans blue leakage assay detects barrier defects in adult mice. n = 16 (TROY.WT), n = 18 (TROY.KO). Data are presented as the mean ± SEM (***p < 0.005; **p < 0.01; *p < 0.05). See also Figure S5 and mmc7VIDEO and mmc8VIDEO. EXPRESSION / LABELING:
PHENOTYPE:
|
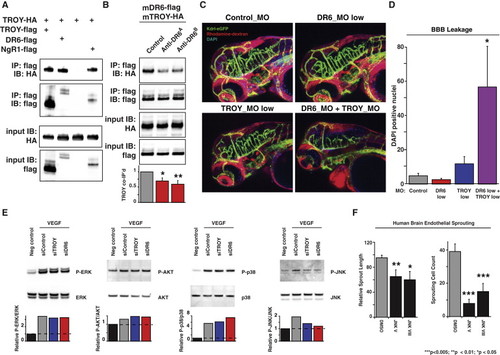
DR6 and TROY Physically and Genetically Interact and Are Required for VEGF-Mediated JNK Activation (A) DR6 physically interacts with TROY. Epitope-tagged receptors were overexpressed in COS-7 cells and flag-tagged TROY bait was immunoprecipitated. Input was 1% total cellular lysate used in pulldown. IP, immunoprecipitation; IB, immunoblot. Results representative of at least three independent experiments are shown. (B) Anti-DR6 function-blocking antibodies, which inhibit human brain endothelial sprouting, also reduce DR6 and TROY physical interaction. Pulldown assays were carried out as described above with the addition of anti-DR6 antibodies four hours after transfection. Relative TROY coimmunoprecipitation was calculated by normalization to both TROY-HA input and DR6-flag pulldown levels. Results representative of at least three independent experiments are shown. (C) Suboptimal concentrations of DR6- and TROY-targeting morpholinos unmask genetic interactions. Each embryo was treated with 4 ng of each splice-blocking morpholino. Endothelial cells are green, DAPI is blue, rhodamine-dextran is red. Results representative of at least three independent experiments are shown. (D) Quantification of DAPI leakage reveals DR6 and TROY genetic interaction. n = 8 (control_MO), n = 8 (DR6_MO), n = 8 (TROY_MO), n = 8 (DR6_MO and TROY_MO). (E) VEGF activates JNK in HBMECs and requires DR6 and TROY expression. Relative protein phosphorylation was calculated by normalization to total protein levels. Results representative of at least three independent experiments are shown. (F) JNK activity is required for HBMEC sprouting. 1 μM JNK inhibitor V or VIII was used. Data are presented as the mean ± SEM (***p < 0.005; **p < 0.01; *p < 0.05). See also Figure S6. EXPRESSION / LABELING:
PHENOTYPE:
|
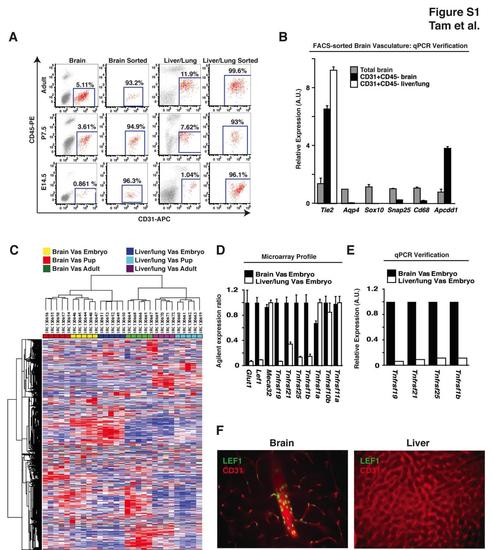
Expression Profiling the Blood-Brain Barrier at Three Developmental Time Points, Related to Figure 1 (A) FACS purification of CD31+CD45- cells from E14.5, P7.5, and adult mice. Single cell suspensions were sorted for CD31+CD45- cells from cerebral cortices and liver/lung tissue to greater than 93% purity. Additional methods were not conducted to further deplete pericytes from the brain vascular cellular preparations. (B) qPCR analysis of FACS purified vasculature. Quantification of transcripts specific to endothelium (Tie2), astrocytes (Aqp4), oligodendrocytes (Sox10), neurons (Snap25), microglia (Cd68), and BBB endothelium (Apcdd1) demonstrate enrichment for BBB endothelium and selection against all other cell types upon FACS purification (Cahoy et al., 2008). (C) Heatmap and dendrogram of microarray expression data from brain and liver/lung tissue. Samples are indicated horizontally across the top of the figure and probes are indicated vertically along the side of the figure. Expression data from the same tissue and developmental time points cluster together, suggesting that these samples are more similar to each other than to the other groups. The following abbreviation is used: Vas, vasculature. (D) Embryonic expression of BBB markers and death receptors. E14.5 embryonic microarray expression data from Figures 1C-E were consolidated. (E) qPCR verification of death receptor enrichment at the BBB. (F) Immunohistochemical analysis of LEF1 expression in the adult mouse cortex and liver. Consistent with our expression profiling data (Figure 1C), we find LEF1-positive nuclei (green) in endothelial cells (CD31: red) from cerebral cortex but not in liver. Results representative of at least three independent experiments are shown. |
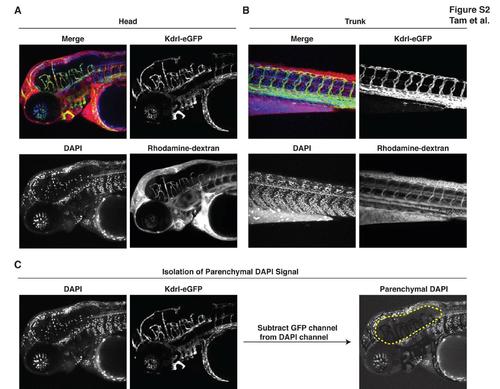
Zebrafish Have a Functional Blood-Brain Barrier at 3 Days Post-Fertilization, Related to Figure 2 (A-B) Upon common cardinal vein microinjection of DAPI (350 Da) and rhodamine-dextran (10 kDa) into Tg(kdrl:egfp) embryos, trunk peripheral tissue leakage of these tracers is widespread whereas within the brain, tracers are tightly restricted within blood vessels. For instance, rhodamine-dextran remains localized within the lumen of brain vasculature and DAPI labels only vascular nuclei but not parenchymal nuclei within the brain. Results representative of at least three independent experiments are shown. Endothelial cells are green, DAPI is blue, rhodamine-dextran is red. (C) Methodology for subtraction blending. DAPI positive brain parenchymal nuclei were visually isolated using Adobe Photoshop CS5 subtraction blending whereby DAPI+GFP+ double-positive signal (DAPI labeling of brain vasculature) was computationally removed from the DAPI channel. |
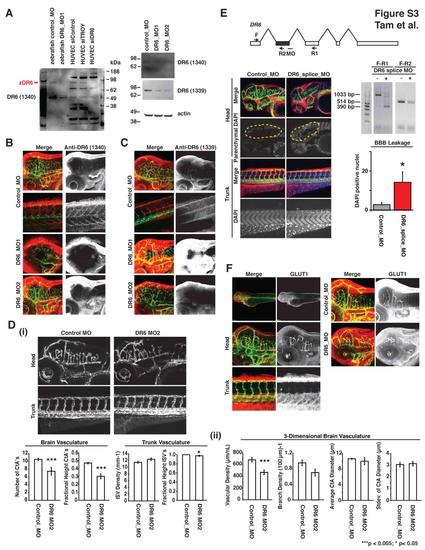
DR6 Zebrafish Expression, Knockdown Confirmation, Additional Morpholino Data, and GLUT1 Localization, Related to Figure 3 (A) Immunoblot verification of DR6 protein expression and knockdown in zebrafish. siRNA targeting DR6 in human umbilical vein endothelial cells (HUVEC) leads to the disappearance of an approximately 90 kDa band from lysates detected by anti-DR6 antibody 1340. Similarly, morpholino-mediated knockdown of zebrafish DR6, using two non-overlapping translation-blocking morpholinos DR6_MO1 and DR6_MO2, also lowers signal of the same 90 kDa band detected by anti-DR6 antibodies 1340 and 1339. Results representative of at least three independent experiments are shown. (B-C) DR6 is expressed in Tg(kdrl:egfp) zebrafish CNS vasculature but not trunk intersegmental vessels. Consistent with mouse expression profiling data, whole mount staining of 3 dpf embryos with anti-DR6 antibodies 1339 and 1340 detects DR6 protein (red) in CNS vasculature (green) but not in the peripheral vasculature. This localization is eliminated upon knockdown mediated by two non-overlapping translation-blocking morpholinos. Images were acquired by confocal microscopy and z-projections are shown. (D) Similar to observations using DR6_MO (aka DR6_MO1) from Figure 3, non-overlapping translation blocking morpholino targeting DR6 (DR6_MO2) has CNS-specific vascular defects in the developing Tg(kdrl:egfp) zebrafish embryo. (i) 2D quantification of 3 dpf zebrafish vasculature utilized n = 36 (control_MO), n = 7 (DR6_MO2). (ii) 3D quantification of 3 dpf zebrafish hindbrain vasculature utilized n = 4 (control_MO), n = 6 (DR6_MO2). Data are presented as the mean ± SEM (***p < 0.005; *p < 0.05). (E) Splice-blocking morpholino targeting DR6 (dr6_splice_MO) deletes targetedexon (shown in grey) and phenocopy translation-blocking morpholinos. 8 ng DR6 splice-blocking morpholino injected 3 dpf embryos lead to CNS-specific vascular and barriergenesis defects. As described in experimental procedures, DAPI-positive brain parenchymal nuclei were visually isolated by computationally removing brain vasculature-derived DAPI signal from the DAPI channel. Two primer sets were used to verify splice-blocking by RT-PCR analysis. n = 8 (control_MO), n = 8 (DR6_splice_MO). Data are presented as the mean ± SEM (*p < 0.05). (F) GLUT1 is enriched at the zebrafish BBB and is not affected by DR6 knockdown. 3 dpf zebrafish embryos injected with control or DR6-targeting morpholinos were analyzed. Whereas GLUT1 signal cannot be found in trunk vasculature, CNS vessels show strong GLUT1 expression. This expression pattern is not changed upon DR6 knockdown. Images were acquired by confocal microscopy and z-projections are shown. EXPRESSION / LABELING:
|
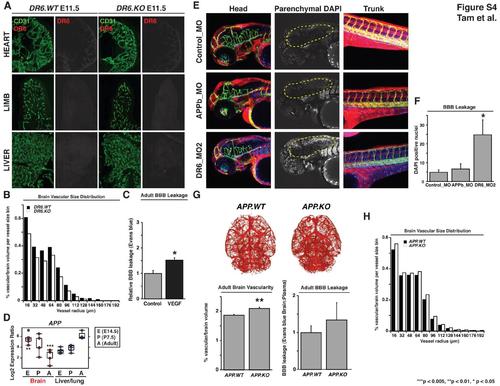
DR6-Ligand APP is Not Required for Proper CNS Barriergenesis and Additional DR6 Knockout Data, Related to Figure 4 (A) DR6 protein expression is absent in CD31-positive peripheral vasculature. Immunohistochemical staining for DR6 protein failed to detect signal in heart, limb, and liver vasculature from E11.5 embryos (left panels). Low background signal is not DR6 protein, as no difference in antibody signal was apparent in DR6.KO embryos (right panels). Results representative of at least three independent experiments are shown. The following abbreviations are used: WT, wild-type; KO, knockout. (B) Vessel size distribution of microCT CNS vascular network indicates that DR6 is required for proper CNS vascular density across all vessel sizes. Vascular density was calculated as a function of vascular volume normalized by brain volume per vessel size bin. No differences were observed between the relative size distributions of the two groups indicating that the reduction in vascular density is uniformally distributed and that DR6 is required for the proper development of a wide range of CNS vessels. n = 6 (DR6.WT), n = 6 (DR6.KO). (C) As previously described, direct intracortical injection of VEGF induces Evans blue leakage across the BBB (Eliceiri et al., 1999). n = 4 (control), n = 4 (VEGF). Data are presented as the mean ± SEM (*p < 0.05). (D) Expression profiling FACS-purified BBB and liver/lung vasculature show enrichment of APP during embryogenesis. Box and whisker plots indicate distribution of data and highlight median (horizontal line through box) and the 25th and 75th quartiles (box edges). Expression values were compared between brain and liver/lung tissue at a single developmental stage and statistical significance was defined as those comparisons yielding an adjusted p-value (***p < 0.005; **p < 0.01). Further details of statistical analysis are described in experimental procedures. (E) Morpholino-mediated APPb knockdown leads to CNS angiogenic defects, but barrier function remains intact. Upon 4 ng control, APPb, or DR6 morpholino injection, both APPb and DR6 knockdown embryos exhibit CNS vascular network defects. Unlike DR6 knockdown however, APPb morphant exclusion of BBB leakage tracer DAPI is indistinguishable from control morpholino-injected embryos. As described in experimental procedures, DAPI-positive brain parenchymal nuclei were visually isolated by computationally removing brain vasculature-derived DAPI signal from the DAPI channel. Endothelial cells are green, DAPI is blue, rhodamine-dextran is red. Results representative of at least three independent experiments are shown. (F) Quantification of DAPI leakage across the zebrafish BBB upon APPb or DR6 knockdown. Significant increase in labeling of brain parenchmyal nuclei is detected upon DR6 knockdown, but not APPb knockdown. n = 7 (control_MO), n = 7 (APPb_MO), n = 7 (DR6_MO2). Data are presented as the mean ± SEM (*p < 0.05). (G) APP knockout adult mice exhibit increased vascular density but not barrier function defects. Vascular projections of APP.WT and APP.KO brains were carried out as in Figure 4C to illustrate the widespread increase in vascular density upon APP deletion. Results representative of at least three independent experiments are shown (top panel). Vascular density was quantified as a function of vascular volume normalized by brain volume. n = 13 (APP.WT), n = 12 (APP.KO). Data are presented as the mean ± standard error of the mean (SEM) (**p < 0.01) (bottom left panel). Evans blue leakage assay detects fully function barrier in adult APP.KO mice. n = 8 (APP.WT), n = 4 (APP.KO) (bottom right panel). (H) Vessel size distribution of microCT CNS vascular network indicates that APP is required for proper CNS vascular density across all vessel sizes. Vascular density was calculated as a function of vascular volume normalized by brain volume per vessel size bin. No differences were observed between the relative size distributions of the two groups indicating that the increase in vascular density is uniformally distributed and that APP is required for the proper development of a wide range of CNS vessels. n = 13 (APP.WT), n = 12 (APP.KO). EXPRESSION / LABELING:
PHENOTYPE:
|
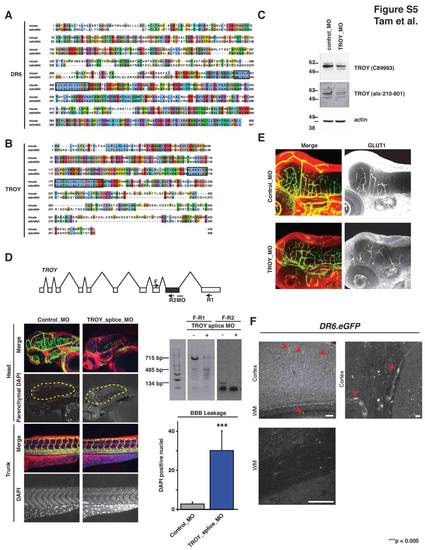
Death Receptor Alignments, TROY Zebrafish Expression, Knockdown Confirmation, Additional Morpholino Data, and GLUT1 Expression, Related to Figure 5 (A-B) Alignments of DR6 and TROY for mouse and zebrafish proteins. Fasta sequences were identified from Ensembl for DR6 (zebrafish:ENSDARP00000036002; mouse: ENSMUSP00000024708) and TROY (zebrafish:ENSDARP00000061350; mouse:ENSMUSP00000106865). The DR6 proteins are 54.4% identical and the TROY proteins are 49.7% identical. Alignments were generated using MAFFT v6.717b (http://align.bmr.kyushu-u.ac.jp/mafft/software/). Transmembrane domains were predicted using TMHMM (http://www.cbs.dtu.dk/services/TMHMM/) and are enclosed in rectangles. (C) Immunoblot verification of TROY protein expression and knockdown in zebrafish. Translation-blocking morpholino targeting zebrafish TROY decreased TROY signal by immunoblot using two different TROY antibodies (C89993 and alx-210-801). Results representative of at least three independent experiments are shown. (D) Splice-blocking morpholino targeting TROY (troy_splice_MO) delete targeted exon (shown in grey) and phenocopy translation-blocking morpholinos. 8 ng TROY splice-blocking morpholino injected 3 dpf embryos lead to CNS-specific vascular and barriergenesis defects. As described in experimental procedures, DAPI-positive brain parenchymal nuclei were visually isolated by computationally removing brain vasculature-derived DAPI signal from the DAPI channel. Two primer sets were used to verify splice-blocking by RT-PCR analysis. n = 8 (control_MO), n = 8 (TROY_splice_MO). Data are presented as the mean ± SEM (***p < 0.005). (E) GLUT1 expression at the zebrafish BBB is not affected by TROY knockdown. 3 dpf zebrafish embryos injected with control or TROY-targeting morpholinos were analyzed. CNS vessels show strong GLUT1 expression. This expression pattern is not changed upon TROY knockdown. Images were acquired by confocal microscopy and z-projections are shown. (F) DR6 is expressed within endothelial cells in the mature central nervous system. Top left panel: EGFP expression is detected broadly throughout the neocortex, including blood vessel endothelial cells (red arrowhead), from postnatal day 60 DR6.EGFP knock-in transgenic animals. Image represents a maximum intensity projection through a 100-μm sagittal section. Bar indicates 100 μm. Top right panel: High magnification illustrating EGFP filling endothelial cell bodies (red arrowhead) and their thin cytoplasmic regions along blood vessels. Bar indicates 10 μm. Bottom left panel: Regions of high myelination, such as white matter, are nearly void of EGFP fluorescence, suggesting DR6 is not expressed significantly within oligodendrocytes. Bar represents 100 um. Similar expression pattern were observed by in situ hybridization staining for DR6 transcript (data not shown). EXPRESSION / LABELING:
|
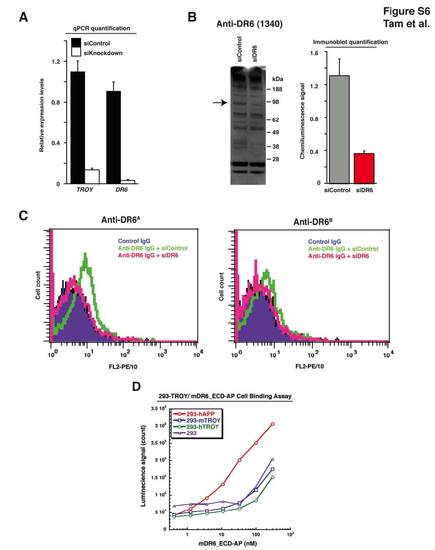
DR6 and TROY Levels Decrease in Response to siRNA-Mediated Knockdown, Anti-DR6 Function-Blocking Antibodies are Specific for DR6 Protein in HBMECs, and DR6/TROY Ectodomains Do Not Directly Interact, Related to Figure 6 (A) qPCR analysis detects knockdown of DR6 and TROY transcript levels upon DR6- and TROY-targeting siRNA transfection in HBMECs. (B) Immunoblot analysis detects knockdown of DR6 protein levels upon DR6-targeting siRNA transfection in HBMECs. Using anti-DR6 antibody 1340, we detect reduction of an approximately 90 kDa band specific to full length DR6 protein. Densitometry quantification of DR6 protein was carried out as described in experimental procedures. (C) Anti-DR6 function-blocking antibodies are DR6-specific in HBMECs. siRNA-mediated knockdown of DR6 abolishes both anti-DR6A and anti-DR6B FACS signal shift. (D) Purified DR6-ectodomain does not directly bind TROY. While hAPP-expressing 293 cells modestly bind DR6 ectodomain, TROY expression does not induce DR6 ectodomain cell binding above background levels. |
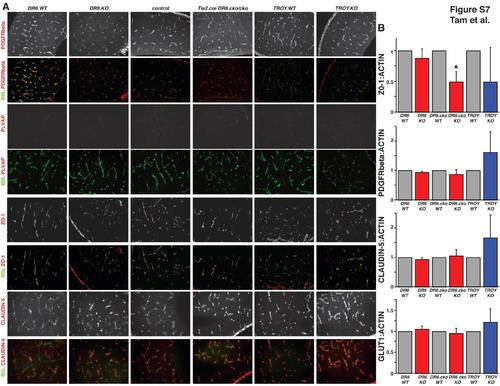
Molecular Characterization of the Blood-Brain Barrier in DR6 and TROY Knockout Embryos, Related to Figure 7 (A) Immunohistochemical analysis of pericyte coverage (PDGFRbeta), barrier maturation (PLVAP), and tight junction morphology (ZO-1 and CLAUDIN-5) of CNS vasculature (BSL: FITC-lectin) in DR6 and TROY knockout E15.5 embryonic mouse cortices. No gross mislocalization or expression level differences could be detected in DR6.KO, DR6flox/flox;Tie2-Cre, and TROY.KO embryos when compared to littermate controls. Results representative of at least three independent experiments are shown. (B) Immunoblot analysis of pericyte coverage (PDGFRbeta), glucose transporter 1 expression (GLUT1), and tight junction expression (ZO-1 and CLAUDIN-5) in DR6, TROY, and DR6flox/flox;Tie2-Cre (DR6.cko) conditional knockout E15.5 embryonic mouse cortices. While no significant PDGFRbeta, GLUT1, or CLAUDIN-5 expression level changes could be detected in DR6.KO, DR6flox/flox;Tie2-Cre, and TROY.KO embryos when compared to littermate controls, ZO-1 levels were significantly reduced in DR6flox/flox;Tie2-Cre embryos, and trending towards reduction in DR6.KO and TROY.KO embryos. Relative protein levels were calculated by normalization to actin loading control levels. Data are presented as the mean ± SEM (*p < 0.05). |
Reprinted from Developmental Cell, 22(2), Tam, S.J., Richmond, D.L., Kaminker, J.S., Modrusan, Z., Martin-McNulty, B., Cao, T.C., Weimer, R.M., Carano, R.A., van Bruggen, N., and Watts, R.J., Death Receptors DR6 and TROY Regulate Brain Vascular Development, 403-417, Copyright (2012) with permission from Elsevier. Full text @ Dev. Cell