
Fig. 1
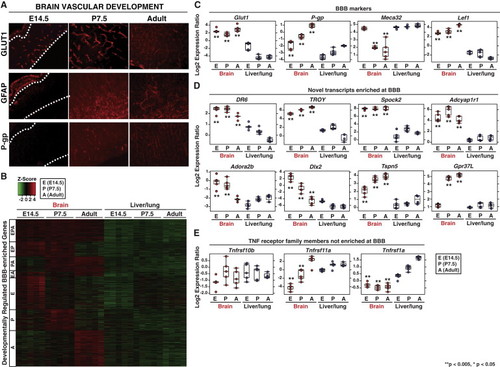
Blood-Brain Barrier Expression Profiling Identifies Genes Enriched in Brain Vasculature (A) Three blood-brain barrier (BBB) developmental time points identified by immunohistochemical analysis of GLUT1 expression and astrocyte localization in the mouse cortex. (GLUT1, endothelial cells; GFAP, astrocytes; P-gp, P-glycoprotein) Results representative of at least three independent experiments are shown. (B) Distinct developmentally regulated classes of BBB-specific transcripts were identified by microarray analysis. Samples are in columns; probes are in rows. Red and green color indicates over- or underexpression of probes in brain tissue relative to liver/lung tissue of the same stage, respectively. Developmental stage is indicated to the left of the heatmap (E, embryo; P, pup; A, adult). The probes shown in the heatmap are also presented in Table S1. (C) Expression profiling FACS-purified BBB and liver/lung vasculature shows enrichment of BBB markers Lef1, P-gp, and Glut1. (D) Selected transcripts enriched at the BBB. (E) TNF receptor family members Tnfrsf1a, 10b, and 11a are not preferentially expressed in CNS vasculature. Box and whisker plots indicate distribution of data and highlight median (horizontal line through box) and the 25th and 75th quartiles (box edges). Expression values were compared between brain and liver/lung tissue at each developmental stage. Statistical significance was defined as those stage-specific comparisons yielding an adjusted p value (**p < 0.005; *p < 0.05). Further details of statistical analysis are described in extended Experimental Procedures. See also Figure S1 and Table S1. |
Reprinted from Developmental Cell, 22(2), Tam, S.J., Richmond, D.L., Kaminker, J.S., Modrusan, Z., Martin-McNulty, B., Cao, T.C., Weimer, R.M., Carano, R.A., van Bruggen, N., and Watts, R.J., Death Receptors DR6 and TROY Regulate Brain Vascular Development, 403-417, Copyright (2012) with permission from Elsevier. Full text @ Dev. Cell