
Fig. 4
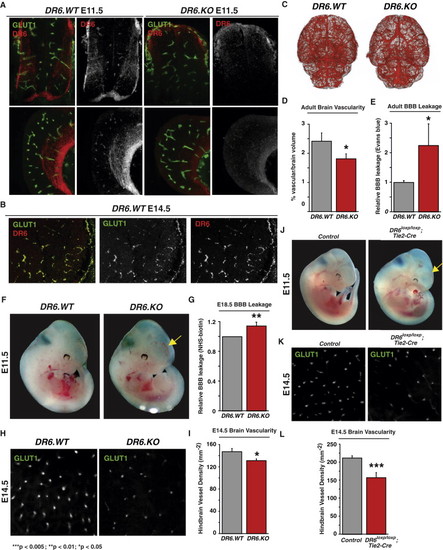
DR6 Is Required for Proper CNS Vascular Density and Barrier Function in Mice in a Cell-Autonomous Fashion (A) DR6 protein expression in CNS commissural axons and GLUT1-positive vasculature. Immunohistochemical staining for DR6 protein exhibited both neuronal and vascular signal in spinal cord (top panels) and forebrain (bottom panels) tissue from E11.5 embryos. This signal is specific to DR6 protein, as no antibody staining was apparent in DR6.KO embryos (right panels). Results representative of at least three independent experiments are shown. WT, wild-type; KO, knockout. (B) DR6 mRNA expression in Glut1-positive vasculature. Dual-target two-color fluorescent in situ hybridization was used to detect DR6 (red) and Glut1 (green) transcripts in mouse E14.5 brains. Results representative of at least three independent experiments are shown. (C) MicroCT angiographic surface renderings of adult mouse brain vasculature. 2D projections of DR6.WT and DR6.KO brains are shown. Results representative of six independent experiments are shown. (D) Quantification of microCT CNS vascular network. Vascular density was calculated as a function of vascular volume normalized by brain volume. n = 6 (DR6.WT), n = 6 (DR6.KO). (E) Evans blue leakage assay detects barrier defects in adult mice. n = 7 (DR6.WT), n = 8 (DR6.KO). (F) E11.5 DR6.KO embryos exhibit forebrain-specific hemorrhaging (observed in 60% embryos tested; arrow). Results representative of at least three independent experiments are shown. (G) Fixable biotin transcardiac perfusion assay detects barrier defects in E18.5 mouse embryos. n = 12 (DR6.WT), n = 12 (DR6.KO). (H) DR6.KO embryos exhibit reduced hindbrain vascular density at E14.5. Confocal images of flat-mounted hindbrains representative of at least nine independent experiments are shown. (I) Quantification of E14.5 mouse hindbrain vascular density. Vascular density was calculated as a function of number of GLUT1-positive hindbrain radial vessels normalized by field area. n = 12 (DR6.WT), n = 11 (DR6.KO). (J) E11.5 DR6flox/flox;Tie2-Cre embryos exhibit forebrain-specific hemorrhaging (observed in 80% embryos tested; arrow). Results representative of at least three independent experiments are shown. (K) E11.5 DR6flox/flox;Tie2-Cre embryos exhibit reduced hindbrain vascular density at E14.5. Confocal images of flat-mounted hindbrains representative of at least nine independent experiments are shown. (L) Quantification of E14.5 mouse hindbrain vascular density. Vascular density was calculated as described above. n = 15 (control), n = 11 (DR6flox/flox;Tie2-Cre). Data are presented as the mean ± SEM (***p < 0.005; **p < 0.01; *p < 0.05). See also Figure S4. |
Reprinted from Developmental Cell, 22(2), Tam, S.J., Richmond, D.L., Kaminker, J.S., Modrusan, Z., Martin-McNulty, B., Cao, T.C., Weimer, R.M., Carano, R.A., van Bruggen, N., and Watts, R.J., Death Receptors DR6 and TROY Regulate Brain Vascular Development, 403-417, Copyright (2012) with permission from Elsevier. Full text @ Dev. Cell