
Fig. S7
- ID
- ZDB-IMAGE-120301-13
- Publication
- Tam et al., 2012 - Death Receptors DR6 and TROY Regulate Brain Vascular Development
- All Figures
- Figures for Tam et al., 2012
|
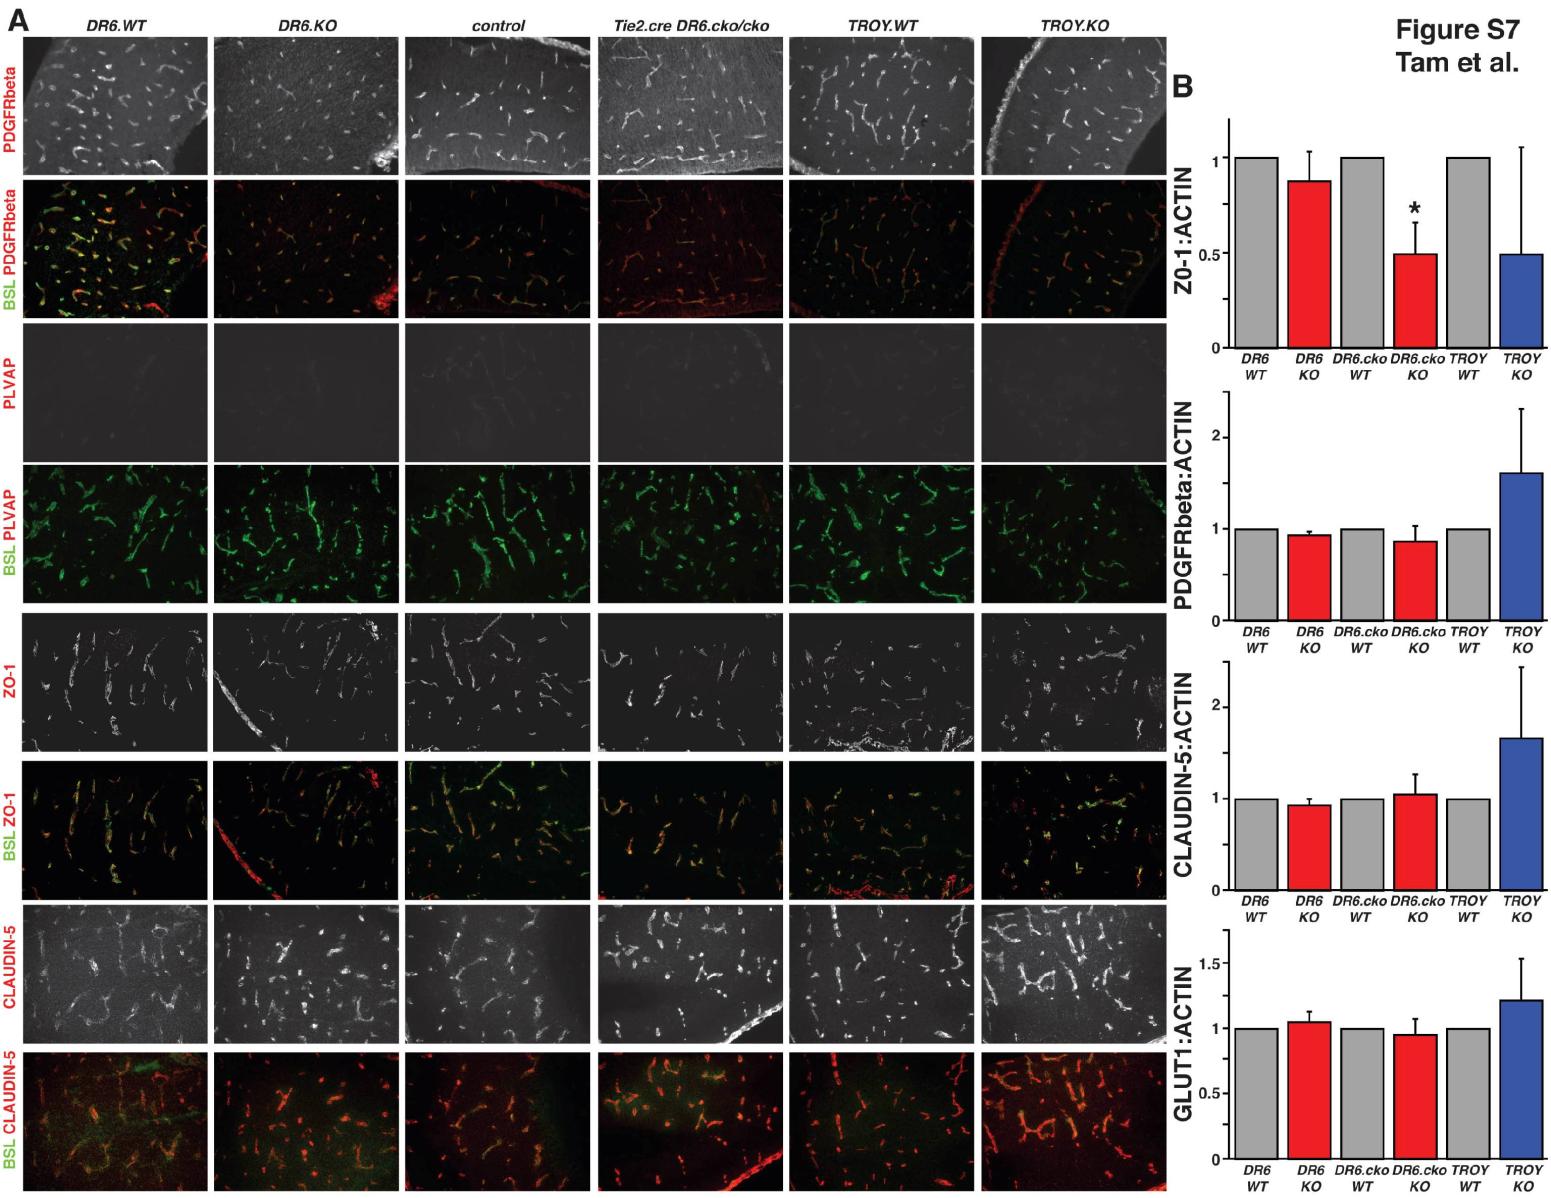
Fig. S7
Molecular Characterization of the Blood-Brain Barrier in DR6 and TROY Knockout Embryos, Related to Figure 7
(A) Immunohistochemical analysis of pericyte coverage (PDGFRbeta), barrier maturation (PLVAP), and tight junction morphology (ZO-1 and CLAUDIN-5) of CNS vasculature (BSL: FITC-lectin) in DR6 and TROY knockout E15.5 embryonic mouse cortices. No gross mislocalization or expression level differences could be detected in DR6.KO, DR6flox/flox;Tie2-Cre, and TROY.KO embryos when compared to littermate controls. Results representative of at least three independent experiments are shown. (B) Immunoblot analysis of pericyte coverage (PDGFRbeta), glucose transporter 1 expression (GLUT1), and tight junction expression (ZO-1 and CLAUDIN-5) in DR6, TROY, and DR6flox/flox;Tie2-Cre (DR6.cko) conditional knockout E15.5 embryonic mouse cortices. While no significant PDGFRbeta, GLUT1, or CLAUDIN-5 expression level changes could be detected in DR6.KO, DR6flox/flox;Tie2-Cre, and TROY.KO embryos when compared to littermate controls, ZO-1 levels were significantly reduced in DR6flox/flox;Tie2-Cre embryos, and trending towards reduction in DR6.KO and TROY.KO embryos. Relative protein levels were calculated by normalization to actin loading control levels. Data are presented as the mean ± SEM (*p < 0.05).
Reprinted from Developmental Cell, 22(2), Tam, S.J., Richmond, D.L., Kaminker, J.S., Modrusan, Z., Martin-McNulty, B., Cao, T.C., Weimer, R.M., Carano, R.A., van Bruggen, N., and Watts, R.J., Death Receptors DR6 and TROY Regulate Brain Vascular Development, 403-417, Copyright (2012) with permission from Elsevier. Full text @ Dev. Cell