
Fig. S5
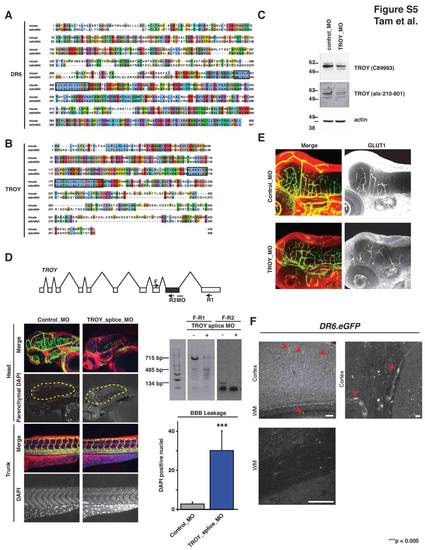
Death Receptor Alignments, TROY Zebrafish Expression, Knockdown Confirmation, Additional Morpholino Data, and GLUT1 Expression, Related to Figure 5 (A-B) Alignments of DR6 and TROY for mouse and zebrafish proteins. Fasta sequences were identified from Ensembl for DR6 (zebrafish:ENSDARP00000036002; mouse: ENSMUSP00000024708) and TROY (zebrafish:ENSDARP00000061350; mouse:ENSMUSP00000106865). The DR6 proteins are 54.4% identical and the TROY proteins are 49.7% identical. Alignments were generated using MAFFT v6.717b (http://align.bmr.kyushu-u.ac.jp/mafft/software/). Transmembrane domains were predicted using TMHMM (http://www.cbs.dtu.dk/services/TMHMM/) and are enclosed in rectangles. (C) Immunoblot verification of TROY protein expression and knockdown in zebrafish. Translation-blocking morpholino targeting zebrafish TROY decreased TROY signal by immunoblot using two different TROY antibodies (C89993 and alx-210-801). Results representative of at least three independent experiments are shown. (D) Splice-blocking morpholino targeting TROY (troy_splice_MO) delete targeted exon (shown in grey) and phenocopy translation-blocking morpholinos. 8 ng TROY splice-blocking morpholino injected 3 dpf embryos lead to CNS-specific vascular and barriergenesis defects. As described in experimental procedures, DAPI-positive brain parenchymal nuclei were visually isolated by computationally removing brain vasculature-derived DAPI signal from the DAPI channel. Two primer sets were used to verify splice-blocking by RT-PCR analysis. n = 8 (control_MO), n = 8 (TROY_splice_MO). Data are presented as the mean ± SEM (***p < 0.005). (E) GLUT1 expression at the zebrafish BBB is not affected by TROY knockdown. 3 dpf zebrafish embryos injected with control or TROY-targeting morpholinos were analyzed. CNS vessels show strong GLUT1 expression. This expression pattern is not changed upon TROY knockdown. Images were acquired by confocal microscopy and z-projections are shown. (F) DR6 is expressed within endothelial cells in the mature central nervous system. Top left panel: EGFP expression is detected broadly throughout the neocortex, including blood vessel endothelial cells (red arrowhead), from postnatal day 60 DR6.EGFP knock-in transgenic animals. Image represents a maximum intensity projection through a 100-μm sagittal section. Bar indicates 100 μm. Top right panel: High magnification illustrating EGFP filling endothelial cell bodies (red arrowhead) and their thin cytoplasmic regions along blood vessels. Bar indicates 10 μm. Bottom left panel: Regions of high myelination, such as white matter, are nearly void of EGFP fluorescence, suggesting DR6 is not expressed significantly within oligodendrocytes. Bar represents 100 um. Similar expression pattern were observed by in situ hybridization staining for DR6 transcript (data not shown). |
| Genes: | |
|---|---|
| Antibodies: | |
| Fish: | |
| Knockdown Reagent: | |
| Anatomical Terms: | |
| Stage: | Protruding-mouth |
Reprinted from Developmental Cell, 22(2), Tam, S.J., Richmond, D.L., Kaminker, J.S., Modrusan, Z., Martin-McNulty, B., Cao, T.C., Weimer, R.M., Carano, R.A., van Bruggen, N., and Watts, R.J., Death Receptors DR6 and TROY Regulate Brain Vascular Development, 403-417, Copyright (2012) with permission from Elsevier. Full text @ Dev. Cell