- Title
-
Gene expression patterns underlying proximal-distal skeletal segmentation in late-stage zebrafish, Danio rerio
- Authors
- Crotwell, P.L., and Mabee, P.M.
- Source
- Full text @ Dev. Dyn.
|
A-D: Cleared and cartilage-stained skeletal preparations showing the progression of segmentation in zebrafish anal fin radials (A-C; adapted from Bird and Mabee,[2003]) and an 18 days postfertilization mouse embryo (D). A: 5.4 mm. B: 5.6 mm. C: 6.5 mm, proximal and distal radials are identified; asterisks mark the zones of segmentation. D: The mouse left forehand is shown here in a dorsal view with anterior at bottom. Two joints in digit four are marked with asterisks. Scale bars = 0.5 mm. |
|
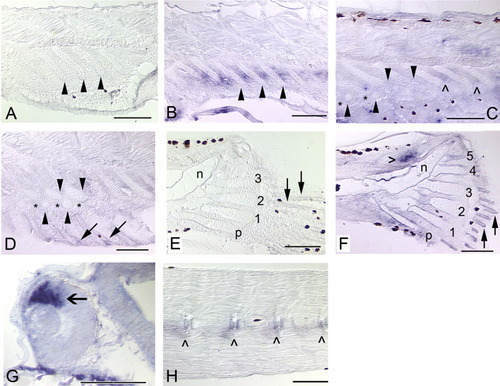
Expression of bmp4 in the median fins and axial skeleton of zebrafish. Solid arrows mark fin rays, arrowheads mark radials, and hypurals are numbered. Black patches are melanophores. Anterior is to the left and dorsal to the top. A: In the same individual as H, bmp4 expression is not detected in the anal fin (5.4 mm). B: At a slightly later stage, bmp4 expression is observed in the interradial mesenchyme (5.7 mm). C: Expression of bmp4 is not detected in the ZS (*) between the proximal (top row of arrowheads) and distal (bottom row of arrowheads) radials, although it is maintained in the interradial mesenchyme (∧) between more posteriorly located, less-developed radials (6.0 mm). D: When radial segmentation is complete, expression of bmp4 is detected only in the fin rays (arrows; 6.6 mm). E: In the same individual as H, bmp4 expression is not detected in the caudal fin (5.4 mm). F: At a slightly later stage, expression is observed in the fin rays and ossifying perichondrium surrounding the hypurals, and very strongly in mesenchyme (hollow arrowhead) dorsal to the notochord (n) of the caudal fin (5.7 mm). G: An open arrow marks expression in the dorsal retina (Chin et al.,[1997]), which served as a positive control (26 hpf). H: Expression of bmp4 in the developing axial skeleton (centra, ∧) is not as robust as the dorsal retina positive control, but is clearly detectable (5.4 mm). Scale bars = 0.1 mm. |
|
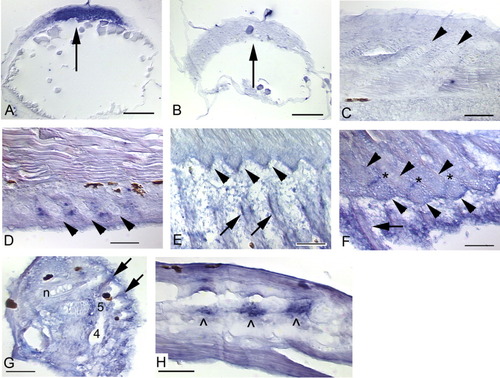
In situ hybridization showing expression of chordin during median fin development in zebrafish. Arrows mark fin rays (except in A,B), arrowheads mark radials, and hypurals are numbered. Black patches are melanophores. Anterior is to the left and dorsal to the top, except in A and B, which are dorsal views (after Miller-Bertoglio et al.,[1997]). A: Strong chordin expression in future dorsal cells (arrow) during the shield stage (Miller-Bertoglio et al.,[1997]) serves as a positive control (∼6 hours postfertilization [hpf]). B,C: Sense probe does not detect chordin early (∼ 6 hpf, B) or late (5.6 mm, C), but does provide relative levels of background staining. D: The chondrocytes of the forming radials (arrowheads) do not express chordin, but the gene can be detected in the mesenchyme between the radials. Expression is not strong, but the stain is distinctly above background levels (5.6 mm). E: As segmentation progresses and fin rays are formed, expression of chordin is observed in the fin rays (arrows), and in the zone of segmentation (ZS; distal radials not present in this plane of section, but note expression at arrowhead tips, which point at the distal edges of the proximal radials) (5.6 mm). F: Expression of chordin in the ZS (asterisks) is clearly visible (5.8 mm). G: Mesenchyme distal to the hypurals expresses chordin (see hypural 5), although not as strongly as we have observed for other genes (6.2 mm). H: The highest levels of chordin expression are detected in the mesenchyme (∧) between the forming posterior neural (shown) and hemal (not shown) arches. Note absence of expression in the arch cartilages (cells to the right of the patches of expression) themselves. Scale bars = 0.1 mm in A,B, 0.05 mm in C,H. |
|
Expression of shh in median fins was assessed in shh:gfp (green fluorescent protein) transgenic zebrafish (Shkumatava et al.,[2004]) by means of confocal microscopy. Black patches are melanophores. Anterior is to the left and dorsal to the top. A: After prescreening for presence or absence of gfp, gfp-negative embryos were used to provide baseline levels of autofluorescence. B: Expression of shh as evidenced by gfp in the ventral diencephalon and the floor plate of the neural tube (not shown) were as expected (Ekker et al.,[1995]). C: Expression in the floor plate of the neural tube (not shown in C, but see F) is maintained for an extensive period of time as a new domain of expression is observed in the caudal fin. Both mesenchyme in the fin and fin rays themselves show strong expression. D: This is observed more clearly in the anal fin. Ray expression is distinct, and anal fin mesenchyme shows high levels of shh. E: Although it appears that the cartilage cells of the radials (arrowheads) express shh, this is an artifact caused by bleed-over of the high levels of mesenchyme fluorescence. F: Absence of shh in the hypurals is apparent, while expression in the distal caudal mesenchyme, caudal fin rays (arrows), and floor plate of the neural tube (or perhaps dorsal notochord, n, see Ekker et al.,[1995]) is maintained. G: The pattern of expression in the anal fin after segmentation is complete shows expression in the mesenchyme in the shape of an H, with the hollow portions of the H consisting of the distal (bottom row of arrowheads) and proximal (top row of arrowheads) radials. The alternating angled light and dark lines in G and H are an artifact of the confocal microscope. H: Although interradial shh expression is maintained after radial segmentation (radials not in plane of section here, but see G), the highest levels of shh expression are observed in the distal and still developing fin rays (arrows), which are not in the plane of section in G. |
|
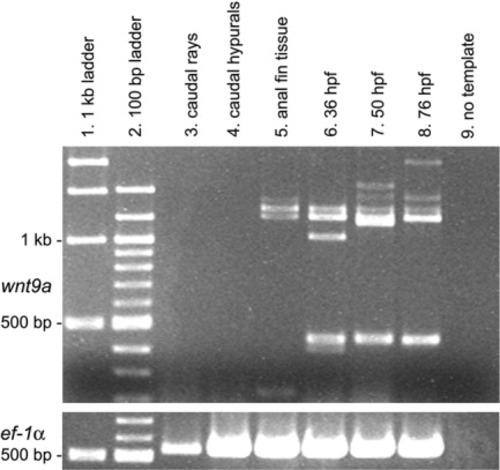
Reverse transcriptase-polymerase chain reaction (RT-PCR) analysis of wnt9a (top panel) in median fins of zebrafish (5.6-6.3 mm). Columns 1 and 2 contain 1-kb and 100-bp ladders, respectively, with 1-kb and 500-bp bands marked at left. Column 9 shows RT-PCR results with no template added to the reaction mix (negative control). Columns 6-8, with 36, 50, and 76 hours postfertilization (hpf) whole embryos, and the bottom panel, with constitutively expressed ef-1α (Nordnes et al.,[1994]), were used as positive controls. Columns 3-5 contain the RT-PCR reaction product for caudal fin rays, caudal hypurals, and anal fin tissue. Note the absence of wnt9a RNA in both caudal fin rays (column 3) and caudal hypurals (column 4), and lack of amplification of the expected ∼440-bp fragment in anal fin tissue (column 5) that is observed in 36, 50, and 76 hpf embryos. Lanes 5-8 exhibit several bands between 1 and 1.5 kb. These could represent tissue-specific splice variants or nonspecific primer binding. No additional ef- 1α bands were observed (not shown). |
|
Reverse transcriptase-polymerase chain reaction (RT-PCR) analysis of wnt9b (top panel) in median fins of zebrafish (5.6-6.3 mm). Column 1 contains a 100-bp ladder with the 500-bp band marked at left. Column 6 shows RT-PCR results with no template added to the reaction mix (negative control). Columns 2, with 50 hours postfertilization (hpf) whole embryos, and the bottom panel, with constitutively expressed ef-1α (Nordnes et al.,[1994]), were used as positive controls. Columns 3-5 contain the RT-PCR reaction product for caudal fin rays, caudal hypurals, and anal fin tissue. Note the presence of wnt9b RNA in caudal fin rays (column 3), caudal hypurals (column 4), and anal fin tissue (column 5). No additional wnt9b or ef-1α bands were detected (not shown). |
|
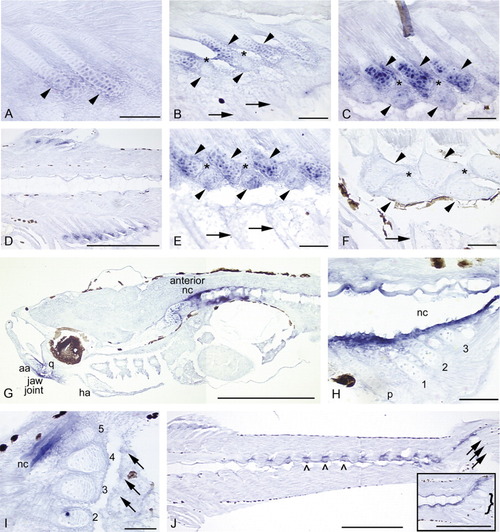
Sagittal sections showing expression of bapx1 in the median fins, head, and trunk of zebrafish. In all panels, anterior is to the left and dorsal to the top. Black patches are melanophores or delimit one of the eyes (G). Arrows mark fin rays, solid arrowheads mark radials, and caret marks mark neural arches. The brown fiber in the top center of C and blue dot in hypural 2 (I) are artifacts. A: In newly forming anal fin radials (5.2 mm), bapx1 expression is observed in the distal chondrocytes and perichondrial cells. B: As radial development progresses (5.6 mm), distal chondrocytes of the proximal radials (top row of arrowheads) continue to express bapx1. bapx1 is not expressed in the ZS (*), the newly formed distal radials (bottom row of arrowheads), or the newly developing fin rays (arrows). C: By 6.4 mm, the distal radials (bottom row of arrowheads) begin to exhibit bapx1 expression, although not at the levels observed in the distal portions of the proximal radials (top row of arrowheads). The ZS (*) does not express the gene. D: The distinct expression pattern of bapx1 is clearly apparent in this section (6.7 mm). Note expression in the distal chondrocytes of the proximal radials, lack of expression in the proximal chondrocytes of the proximal radials and the ZS, and an increase in expression in the distal radials. E: In this 6.8-mm specimen, distal radial bapx1 expression is stronger (bottom row of arrowheads); fin rays do not express the gene (arrows). F: ∼9.0 mm SL: bapx1 expression is no longer detectable in the dorsal and anal fin supports and axial skeleton (9.4 mm). G: At 4.5 mm NL, bapx1 expression in the anterior notochord (nc) is strong. Additional expression domains are observed in the developing posterior articular (aa) and ventral quadrate (q) bones, which together form the jaw joint. Expression is not observed in the anterior anguloarticular or dorsal quadrate, or in the hyoid arch (ha). H: Tissue surrounding the posterior notochord strongly expresses bapx1 (4.5 mm NL). The parhypural (p) and hypurals 1-3 are present, but do not express the gene. I: Posterior notochord expression remains strong at 5.2 mm. All five hypurals are present (2-5 shown); neither hypurals nor caudal fin rays (arrows) express bapx1. J: Neural and hemal arches (∧) and spines (not visible in this plane of section) and the posterior notochord express bapx1 at 6.7 mm. Note continued lack of expression in the fin rays (arrows) and caudal fin supports (curly brackets, inset). Scale bars = 0.5 mm in D,G,J, 0.05 mm in all others. EXPRESSION / LABELING:
|
|
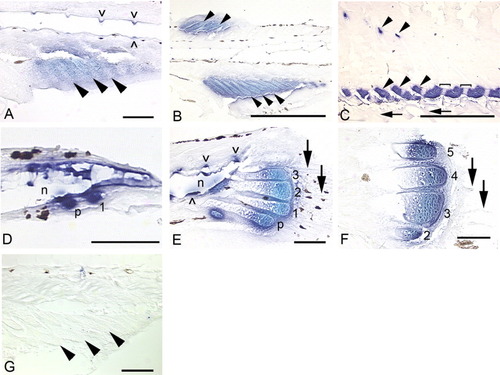
Sagittal sections showing expression of the type II collagen gene in the median fins of zebrafish. In all panels, anterior is to the left and dorsal to the top. Black patches are melanophores. A: Early expression in the anal fin field (5.1 mm). Both prechondrogenic mesenchyme and radial chondrocytes (arrowheads) express type II collagen. B: Type II collagen is expressed throughout the fin field of both dorsal and anal fins (5.7 mm). Stain of mature chondrocytes in the radials is turquoise in color while interradial mesenchyme stains purple (this is loosely correlated to relative gene expression levels, with higher levels appearing as turquoise; R. Harland, personal communication). C: After radial segmentation is complete, type II collagen expression remains in the distal radials and the bands of cartilage that remain unossified in the distal portion of the proximal radials (arrowheads; 12.2 mm). This pattern is observed in the dorsal fin as well (data not shown). A few cells in the most proximal portion of the proximal radials (top arrowheads) also express type II collagen. D: Strong expression in mesenchymal condensations of the parhypural (p) and hypural one (1; 4.0 mm NL). E: Stain of mature chondrocytes in the hypurals is turquoise in color while inter-hypural mesenchyme stains purple (5.7 mm). A developing hemal arch expresses type II collagen as well (∧). Fin rays do not express the gene (arrows). F: Type II collagen expression becomes increasingly distally restricted as the hypurals continue to grow to adult size (11.3 mm). G: Sense probe does not exhibit any staining. Scale bars = 0.1 mm in A,D,G, 0.5 mm in B,C. EXPRESSION / LABELING:
|
|
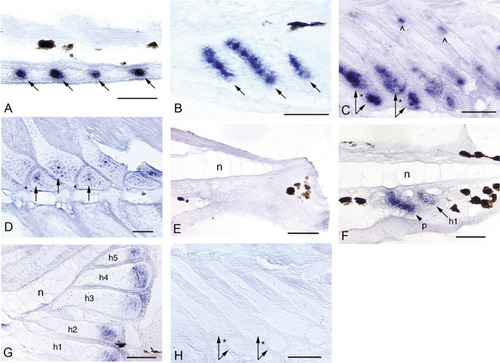
Expression of noggin3 in the median fins of zebrafish. Anterior is to the left and dorsal is to the top. Black patches are melanophores. An "n" marks the notochord in the caudal fin (E-G). Arrows mark noggin3 expression in radials/hypurals, an arrowhead and p mark the parhypural. Hypurals are numbered in the order of their development (h1-h5). A: Initial expression of noggin3 in the dorsal and anal fins occurs in a series of pre-cartilage condensations that mark the sites of future anal radial development (4.5 mm NL). B: By 5.1 mm NL, radial chondrocytes are distinct and express noggin3 along the full length of each forming radial; surrounding perichondrial cells also express noggin3. C: When segmentation of the radial into proximal and distal pieces occurs (arrow pairs, 6.0 mm), noggin3 is down-regulated in the ZS (*) and in chondrocytes that are no longer proliferative. Both the distal portion of the proximal radial and the distal radial remain proliferative and strongly express noggin3 (arrow pairs). A small domain of proliferation and noggin3 expression remains at the proximal tip of the proximal radial (∧). D: By 8.8 mm, expression is detected in only a few chondrocytes (arrows) in the distal portion of the proximal radial and the distal radial; this ceases by ∼9.2 mm (not shown). E: Before ∼4 days postfertilization (dpf), no expression is observed in the caudal fin in the region below the notochord that will give rise to the caudal fin hypurals and parhypural (3.6 mm NL). F: Presumptive parhypural (p) and hypural (h1) condensations express noggin3 in a slightly older specimen (3.7 mm NL). G: Expression of noggin3 in the caudal fin becomes restricted to the posterior, proliferative chondrocytes of the hypurals (5.8 mm), and ceases at ∼9.5 mm (not shown). H: No cells are labeled by the noggin3 sense probe control (5.8 mm). Scale bars = 0.05 mm. EXPRESSION / LABELING:
|
|
Reverse transcriptase-polymerase chain reaction (RT-PCR) analysis of sox9a (top panel) and sox9b (middle panel) in median fins of zebrafish (5.6-6.3 mm). Column 1 contains a 100-bp ladder with appropriately sized bands marked at left. Column 2, with 50 hours postfertilization (hpf) whole embryos (Chiang et al.,[2001b]), and the bottom panel, with constitutively expressed ef-1α (Nordnes et al.,[1994]), were used as positive controls. Columns 3-5 show presence and relative levels of amplified RNA for caudal fin rays, caudal hypural tissue and anal fin tissue, respectively. While sox9a is strongly expressed in the sampled median fin tissues, sox9b is not detected at all, although it is present in 50 hpf whole embryos, as expected (Chiang et al.,[2001b]). Column 6 shows RT-PCR results with no template added to the reaction mix (negative control). EXPRESSION / LABELING:
|
|
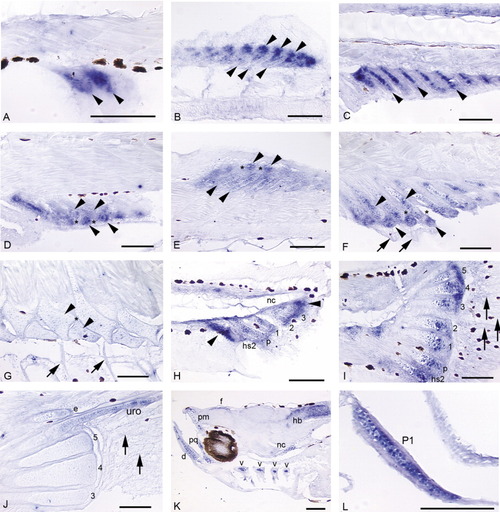
A-L: Expression of sox9a in a developmental fin series (A-J; 4.0 mm NL, 11.5 mm) and head and early pectoral fin (K,L; positive controls).A: Mesenchymal condensations that will give rise to the first two to three anal fin radials express sox9a before cartilage differentiation (4.3 mm NL). B: The stacked chondrocytes of the dorsal fin radials express sox9a (bottom row of arrowheads). Expression is very strong in "balls" of distal mesenchyme (top row arrowheads) that presumably will be incorporated into developing radials (5.3 mm). C: Stacked chondrocytes of the anal fin radials strongly express sox9a, as does distal mesenchyme (not shown in this plane of section, but see B; 5.4 mm). D,E: In both the anal (D) and dorsal (E) fins, as distal radials (D, bottom arrowheads; E, top arrowheads) segment from proximal radials (D, top arrowheads; E, bottom arrowheads), cells in the zone of segmentation (ZS; see *) exhibit down-regulation of sox9a expression. Expression in anal and dorsal fin rays is not detected (fin rays not visible in these planes of section). F: Segmentation is complete. Chondrocytes in distal and proximal radials (arrowheads) continue to express sox9a, while it is not detected in the ZS (*) or in fin rays (arrows; 6.4 mm). G: As radial ossification progresses, expression of sox9a in dorsal and anal fins tapers off in zebrafish > 1 month postfertilization (11.5 mm). H: Below the pre-flexion notochord (nc), hemal spine 2 (hs2), the parhypural (p), and hypurals 1-3 are present and express the gene. Additionally, mesenchyme anterior to hemal spine 2, posterior to hypural 3, and distal to each caudal cartilage condensation strongly expresses sox9a (4.0 mm NL). I: Caudal fin expression is maintained in distal mesenchyme and distal proliferative chondrocytes of the hypurals (1-5), parhypural (p), and hemal spine 2 (hs2), and is observed in proximal chondrocytes of the parhypural and hemal spine 2 (arrowheads). Intermediate regions of the caudal fin supports have begun to ossify (Bird and Mabee,[2003]) and do not express sox9a. Expression in the caudal fin rays is not detected by in situ hybridization (arrows; 5.9 mm). J: In the ossifying caudal fin, expression is no longer detected in hypurals, although it is observed in the developing uroneural (uro) and epural (e; 11.5 mm). K: Expression of sox9a is observed in all cranial cartilages: shown here are the dentary (d), premaxilla (pm), palatoquadrate (pq), and branchial arches (hollow arrowheads). Additional domains of expression are seen in anterior notochord (nc) and in neural cells of the hindbrain (hb) and below the frontals (f) (4.0 mm NL). L: Chondrocytes in early pectoral fin (P1) strongly express sox9a (positive control; Yan et al.,[2002]). Scale bars = 0.1 mm. EXPRESSION / LABELING:
|


