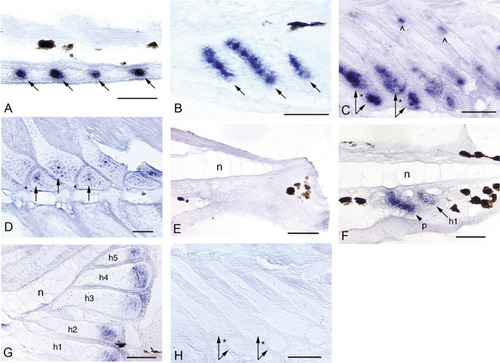
Expression of noggin3 in the median fins of zebrafish. Anterior is to the left and dorsal is to the top. Black patches are melanophores. An "n" marks the notochord in the caudal fin (E-G). Arrows mark noggin3 expression in radials/hypurals, an arrowhead and p mark the parhypural. Hypurals are numbered in the order of their development (h1-h5). A: Initial expression of noggin3 in the dorsal and anal fins occurs in a series of pre-cartilage condensations that mark the sites of future anal radial development (4.5 mm NL). B: By 5.1 mm NL, radial chondrocytes are distinct and express noggin3 along the full length of each forming radial; surrounding perichondrial cells also express noggin3. C: When segmentation of the radial into proximal and distal pieces occurs (arrow pairs, 6.0 mm), noggin3 is down-regulated in the ZS (*) and in chondrocytes that are no longer proliferative. Both the distal portion of the proximal radial and the distal radial remain proliferative and strongly express noggin3 (arrow pairs). A small domain of proliferation and noggin3 expression remains at the proximal tip of the proximal radial (∧). D: By 8.8 mm, expression is detected in only a few chondrocytes (arrows) in the distal portion of the proximal radial and the distal radial; this ceases by ∼9.2 mm (not shown). E: Before ∼4 days postfertilization (dpf), no expression is observed in the caudal fin in the region below the notochord that will give rise to the caudal fin hypurals and parhypural (3.6 mm NL). F: Presumptive parhypural (p) and hypural (h1) condensations express noggin3 in a slightly older specimen (3.7 mm NL). G: Expression of noggin3 in the caudal fin becomes restricted to the posterior, proliferative chondrocytes of the hypurals (5.8 mm), and ceases at ∼9.5 mm (not shown). H: No cells are labeled by the noggin3 sense probe control (5.8 mm). Scale bars = 0.05 mm.
|
