
Fig. 9
- ID
- ZDB-IMAGE-071115-17
- Genes
- Publication
- Crotwell et al., 2007 - Gene expression patterns underlying proximal-distal skeletal segmentation in late-stage zebrafish, Danio rerio
- All Figures
- Figures for Crotwell et al., 2007
|
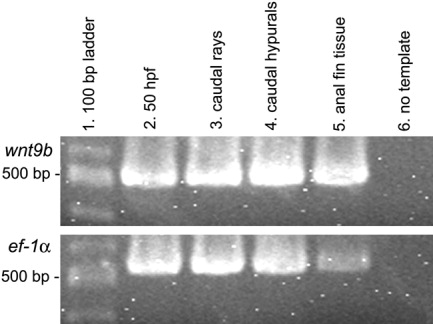
Fig. 9 Reverse transcriptase-polymerase chain reaction (RT-PCR) analysis of wnt9b (top panel) in median fins of zebrafish (5.6-6.3 mm). Column 1 contains a 100-bp ladder with the 500-bp band marked at left. Column 6 shows RT-PCR results with no template added to the reaction mix (negative control). Columns 2, with 50 hours postfertilization (hpf) whole embryos, and the bottom panel, with constitutively expressed ef-1α (Nordnes et al.,[1994]), were used as positive controls. Columns 3-5 contain the RT-PCR reaction product for caudal fin rays, caudal hypurals, and anal fin tissue. Note the presence of wnt9b RNA in caudal fin rays (column 3), caudal hypurals (column 4), and anal fin tissue (column 5). No additional wnt9b or ef-1α bands were detected (not shown).