
- Title
-
Development of BCR-ABL1 Transgenic Zebrafish Model Reproducing Chronic Myeloid Leukemia (CML) Like-Disease and Providing a New Insight into CML Mechanisms
- Authors
- Zizioli, D., Bernardi, S., Varinelli, M., Farina, M., Mignani, L., Bosio, K., Finazzi, D., Monti, E., Polverelli, N., Malagola, M., Borsani, E., Borsani, G., Russo, D.
- Source
- Full text @ Cells
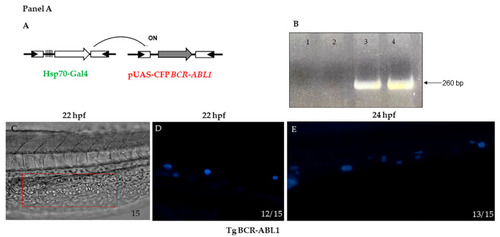
Panel A. (A) Schematic representation of strategy used to express the BCR-ABL1 fusion transcript from the Tg BCR-ABL1pUAS/hsp70-Gal4 fish. (B) Transgenic genotyping by PCR: tail fin from three months old fish was excised and cDNA amplified by specific primers; lane 1 negative control (water); lane 2 wild type fish; lane 3 transgenic fish expressing hBCR-ABL1; lane 4 positive control (plasmid) (C) Representative bright light image (phase contrast) of a trunk portion from 13 to 21 somites at 22 hpf corresponding to a region of intermediate cell mass (ICM) is boxed. (D,E) higher magnification of CFP expression in tg BCR-ABL1pUAS/hsp70-Gal4 after heat treatment; CFP is detectable in cells located in the region of PBI at early stages of development respectively at 22 hpf and 24 hpf. Lateral view and magnification 10 X C; lateral view and magnification 20 X D, E. Numbers in each panel represent total embryos observed for each experiment. Experiments were performed twice. Panel B. Digital PCR quantification of BCR-ABL1 transcript. BCR-ABL1 transcript was quantified by Quant Studio digital PCR system on Tg BCR-ABL1 and wild type embryos pools at 24, 48 and 72 hpf. Digital PCR graph represents the emission of fluorescence in the micro-reactions. Every pool was quantified twice on 2 different chips, each one divided in 20.000 micro reaction. Yellow dots represent negative micro-reaction (no emission), while blue dots represent positive reactions (emission in FAM). Each positive reaction contains one or two molecules of BCR-ABL1 transcript after Poisson distribution correction. hpf = hours post fertilization; WT = wild type. EXPRESSION / LABELING:
|

Panel A. (A) Schematic representation of strategy used to express the BCR-ABL1 fusion transcript from the Tg BCR-ABL1pUAS/hsp70-Gal4 fish. (B) Transgenic genotyping by PCR: tail fin from three months old fish was excised and cDNA amplified by specific primers; lane 1 negative control (water); lane 2 wild type fish; lane 3 transgenic fish expressing hBCR-ABL1; lane 4 positive control (plasmid) (C) Representative bright light image (phase contrast) of a trunk portion from 13 to 21 somites at 22 hpf corresponding to a region of intermediate cell mass (ICM) is boxed. (D,E) higher magnification of CFP expression in tg BCR-ABL1pUAS/hsp70-Gal4 after heat treatment; CFP is detectable in cells located in the region of PBI at early stages of development respectively at 22 hpf and 24 hpf. Lateral view and magnification 10 X C; lateral view and magnification 20 X D, E. Numbers in each panel represent total embryos observed for each experiment. Experiments were performed twice. Panel B. Digital PCR quantification of BCR-ABL1 transcript. BCR-ABL1 transcript was quantified by Quant Studio digital PCR system on Tg BCR-ABL1 and wild type embryos pools at 24, 48 and 72 hpf. Digital PCR graph represents the emission of fluorescence in the micro-reactions. Every pool was quantified twice on 2 different chips, each one divided in 20.000 micro reaction. Yellow dots represent negative micro-reaction (no emission), while blue dots represent positive reactions (emission in FAM). Each positive reaction contains one or two molecules of BCR-ABL1 transcript after Poisson distribution correction. hpf = hours post fertilization; WT = wild type. |

Panel (A). (A,C) Bright-light images of live wild type (WT) and Tg BCR-ABL1 at 24 hpf; the accumulated hematopoietic cells are indicated in the red box. (B,D) The areas in the red boxes are shown at higher magnification (12.5 X). The region (boxed) of posterior blood islands is enlarged and show the immunofluorescence staining of phospohistone3. All the experiments were performed at least in triplicate; images show one representative experiment. Numbers in each panel represent total embryos used for the experiment and embryos with the phenotype shown in the image. (E) Immunostaining with phospohistone 3 (PH3) to label cells in M-phase: percentage of PH3 positive cells over the total number cells present in posterior blood islands. (Magnification 7X A, C; 12.5 X B, D) Blue bar represents wild type; red bar represents Tg BCR-ABL1. Statistical analysis was performed by unpaired, two-tailed T Test **** p < 0.0001. Panel (B) (A,B) Bright light images of wild type (WT) and Tg BCR-ABL1 at 48 hpf. The images show a particular of the caudal hematopoietic tissue (CHT). Red arrows indicate cells accumulated in CHT. (C) The graph of BrdU staining show the percentage of proliferating cells in WT and Tg BCR-ABL1 at 24, 48 and 72 hpf; (D) Quantification of the fluorescence of embryos at 24 and 48 hpf shown in Figure S3 acquired by ZF-Mapper software. Blue bar represents wild type; red bar represents Tg BCR-ABL1. All the experiments were done at least three times. Unpaired, two-tailed t-test *** p < 0.001, **** p < 0.0001. |

Panel (A). (A,C) Bright-light images of live wild type (WT) and Tg BCR-ABL1 at 24 hpf; the accumulated hematopoietic cells are indicated in the red box. (B,D) The areas in the red boxes are shown at higher magnification (12.5 X). The region (boxed) of posterior blood islands is enlarged and show the immunofluorescence staining of phospohistone3. All the experiments were performed at least in triplicate; images show one representative experiment. Numbers in each panel represent total embryos used for the experiment and embryos with the phenotype shown in the image. (E) Immunostaining with phospohistone 3 (PH3) to label cells in M-phase: percentage of PH3 positive cells over the total number cells present in posterior blood islands. (Magnification 7X A, C; 12.5 X B, D) Blue bar represents wild type; red bar represents Tg BCR-ABL1. Statistical analysis was performed by unpaired, two-tailed T Test **** p < 0.0001. Panel (B) (A,B) Bright light images of wild type (WT) and Tg BCR-ABL1 at 48 hpf. The images show a particular of the caudal hematopoietic tissue (CHT). Red arrows indicate cells accumulated in CHT. (C) The graph of BrdU staining show the percentage of proliferating cells in WT and Tg BCR-ABL1 at 24, 48 and 72 hpf; (D) Quantification of the fluorescence of embryos at 24 and 48 hpf shown in Figure S3 acquired by ZF-Mapper software. Blue bar represents wild type; red bar represents Tg BCR-ABL1. All the experiments were done at least three times. Unpaired, two-tailed t-test *** p < 0.001, **** p < 0.0001. PHENOTYPE:
|
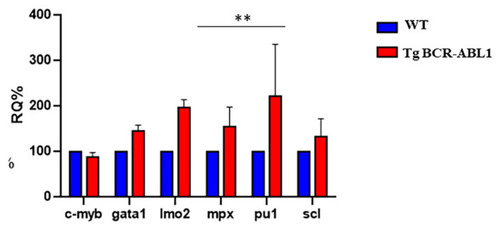
Expression level analysis of hematopoiesis markers. RT-PCR for transcript quantification of six known genes involved in hematopoiesis process. Gene expression was normalized using α elongation factor1 as a reference gene and expressed as relative quantification (RQ). Blue bars represent wild type; red bars represent Tg BCR-ABL1. Statistical analysis was performed by unpaired |

BCR-ABL1 induces a granulopoiesis expansion and granulocytes differentiation. Whole mount in situ hybridization (WISH) of scl at 24 hpf in Wild Type (WT) ( |

Transcriptional changes of erythropoiesis markers. Whole mount in situ hybridization (WISH) at 28 hpf of |
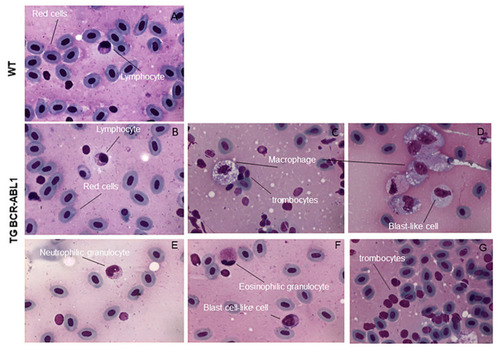
Cytological analysis of transgenic fish expressing hBCR-ABL1. May-Grunwald-Giemsa staining of peripheral blood cells from wild type (A) and Tg BCR-ABL1. Samples are representative of 15 wild type and Tg BCR-ABL1 fish 15 months old. Different types of cells are indicated in the pictures in (C?G). PHENOTYPE:
|
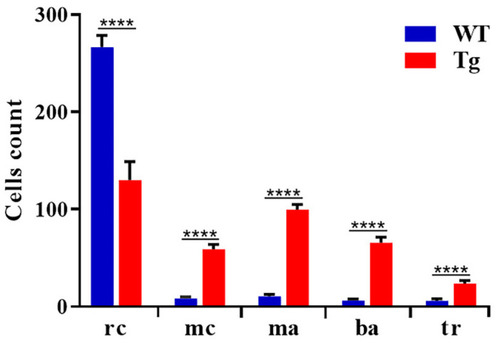
Quantification of different cell types in peripheral blood. Blood cells were counted manually based on their morphology and classified in different groups. We counted 500 cells per field for wild type (n = 15) and Tg BCR-ABL1 (n = 15). Statistical analysis was performed by unpaired, two-tailed T Test **** p< 0.0001. rc = red cells; mc = myeloid cells; ma = macrophages; ba = blast aggregates; tr = tromobocytes. PHENOTYPE:
|

Hematoxylin-eosin staining on paraffin embedded longitudinal section (8 um) in wild type (WT) and tg BCR-ABL1 fish. Spleen (A,B) and kidney (C,D) are reported. Different histological and morphological structures are indicated blue arrows. (Magnification 40�) Bar 30 um. PHENOTYPE:
|