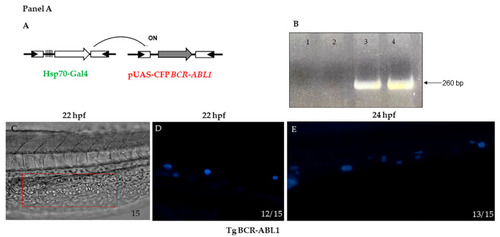
Panel A. (A) Schematic representation of strategy used to express the BCR-ABL1 fusion transcript from the Tg BCR-ABL1pUAS/hsp70-Gal4 fish. (B) Transgenic genotyping by PCR: tail fin from three months old fish was excised and cDNA amplified by specific primers; lane 1 negative control (water); lane 2 wild type fish; lane 3 transgenic fish expressing hBCR-ABL1; lane 4 positive control (plasmid) (C) Representative bright light image (phase contrast) of a trunk portion from 13 to 21 somites at 22 hpf corresponding to a region of intermediate cell mass (ICM) is boxed. (D,E) higher magnification of CFP expression in tg BCR-ABL1pUAS/hsp70-Gal4 after heat treatment; CFP is detectable in cells located in the region of PBI at early stages of development respectively at 22 hpf and 24 hpf. Lateral view and magnification 10 X C; lateral view and magnification 20 X D, E. Numbers in each panel represent total embryos observed for each experiment. Experiments were performed twice. Panel B. Digital PCR quantification of BCR-ABL1 transcript. BCR-ABL1 transcript was quantified by Quant Studio digital PCR system on Tg BCR-ABL1 and wild type embryos pools at 24, 48 and 72 hpf. Digital PCR graph represents the emission of fluorescence in the micro-reactions. Every pool was quantified twice on 2 different chips, each one divided in 20.000 micro reaction. Yellow dots represent negative micro-reaction (no emission), while blue dots represent positive reactions (emission in FAM). Each positive reaction contains one or two molecules of BCR-ABL1 transcript after Poisson distribution correction. hpf = hours post fertilization; WT = wild type.
|
