
Image
|
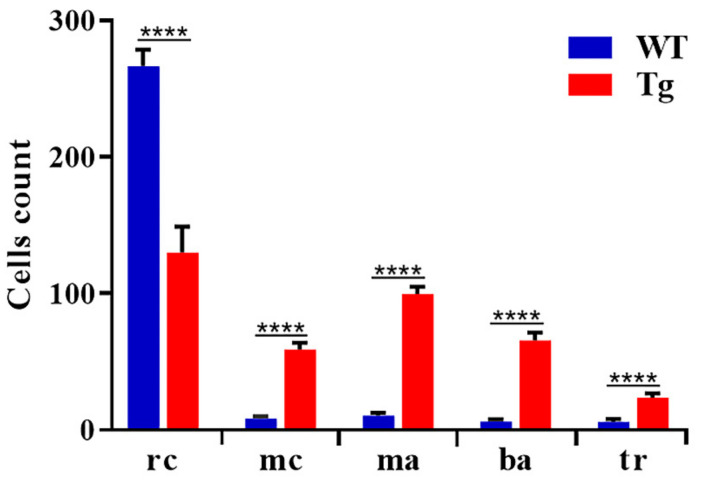
Figure Caption
Figure 7 Quantification of different cell types in peripheral blood. Blood cells were counted manually based on their morphology and classified in different groups. We counted 500 cells per field for wild type (n = 15) and Tg BCR-ABL1 (n = 15). Statistical analysis was performed by unpaired, two-tailed T Test **** p< 0.0001. rc = red cells; mc = myeloid cells; ma = macrophages; ba = blast aggregates; tr = tromobocytes.
Figure Data
Acknowledgments
This image is the copyrighted work of the attributed author or publisher, and
ZFIN has permission only to display this image to its users.
Additional permissions should be obtained from the applicable author or publisher of the image.
Full text @ Cells